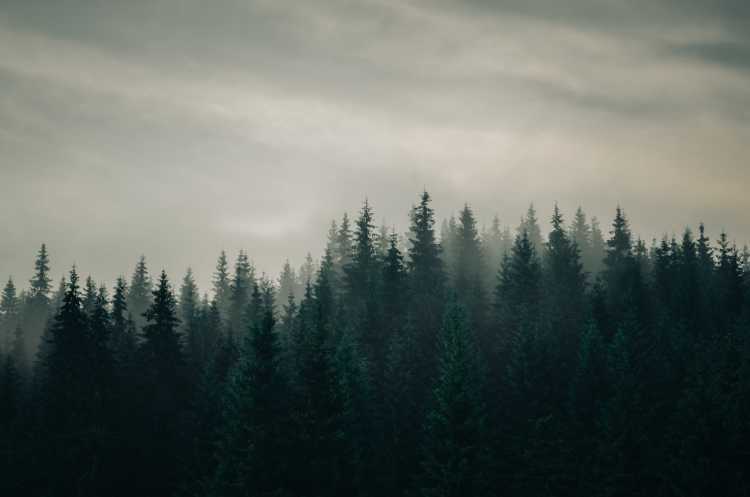
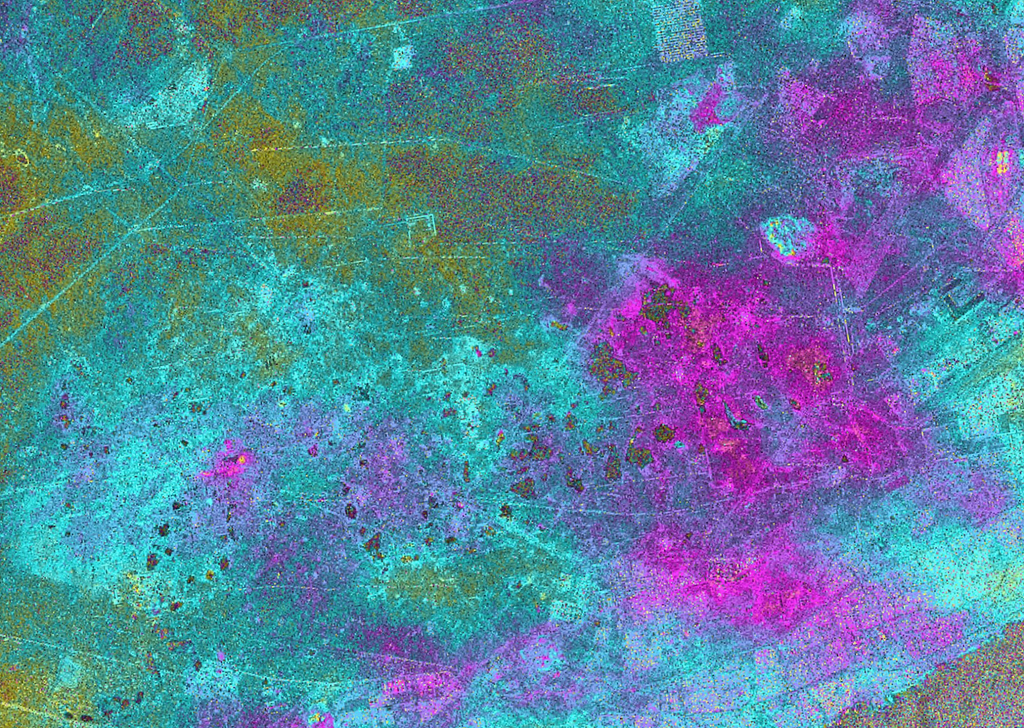
Europe’s last great forests are disappearing. In the first of a four-part Earth Day series, here’s how to monitor Romania’s deforestation using satellite data and analysis.
Every year, Earth Day is celebrated on 22 April in appreciation of our planet, its inhabitants and the environment we increasingly need to protect. This year, the global initiative turns 50 and in honor of this, we’re launching a four-part series that takes a closer look at areas of Earth that are experiencing environmental changes.
We’ll be spotlighting each of the Earth elements: Earth, Water, Air, and Fire. The theme of this year is climate action. Which is why we'll ask and answer a question related to the element every time—using geospatial data and analytics to extract insight and raise awareness of our changing world.
First up: Simularity’s Peter Koning looks at Earth.
Q: How do we detect deforestation in Romania from space?
Every year, vast areas of forests continue to be lost. Rates and causes of deforestation vary around the world, with annual deforestation estimated as 13.7 million hectares a year, equal to an area the size of Greece. Forests influence the global climate, are home to 80% of life on land, and are a major carbon sink—absorbing 2 billion tonnes of carbon each year.
How can satellites help? By getting timely and precise information into the hands that need it most.
In this article, I’ll walk you through how to analyze satellite imagery and detect deforestation in an area we already know it’s been happening. We’ll look at the central-eastern Europe region of Romania.
Known for being home to Europe’s last great forests, Romania’s virgin forests are the largest area of untouched, old-growth woodland. They’re of invaluable ecological value and home to healthy populations of bears, wolves, and lynx.
Romania's forests are rapidly vanishing due to illegal large-scale logging. This excerpt from a recent article on the situation describes more (OBC Transeuropa, 2020).
“With the aid of satellite images, Global Forest Watch has calculated that 317,000 hectares of Romanian forest were lost to logging between 2001 and 2017. That’s the equivalent of 444,000 football pitches. Half of these trees were in national parks or conservation areas and were hundreds of years old. “While the deforestation of the Amazon rainforest has been horrifying people for years, hardly anyone realises that Europe contains remnants of virgin forests that are just as important. The fact that the majority of these are on our doorstep, in the Carpathians, and are under threat remains an untold story,” says David Gehl from the Environmental Investigation Agency (EIA), a US NGO investigating the predatory exploitation of nature throughout the world.”

To take a closer look, we’ll first establish regular monitoring of an area in Romania where we suspect some deforestation has been happening: Piatra Craiului National Park.
We’ll be combining Airbus’ Pléiades satellite imagery and Simularity’s temporal change detection algorithm: [Automatic Image Anomaly Detection System (AIADS)] using UP42.
When creating a one time project with a specific area of interest (AOI) and time period, then our first step would be to use UP42’s Catalog Search to confirm that imagery is available for us to analyze. However, for this instance as we plan to run the same job over an area at regular intervals, we can skip this step.
How to:
1. Our first step is to create a workflow that takes Airbus Pléiades imagery and analyzes the images for temporal change using Simularity’s AIADS processing algorithm.
Let’s build the workflow with these two blocks (units of data or processing on UP42) as follows:


2. Next, we can immediately configure a job to use this workflow.
We select the AOI of a forested area in Piatra Craiului National Park, where it’s clear that some tree cutting has already occurred last year. Note how the geo json is automatically generated in the left window once the AOI has been selected. If you already have your geo json ready then you can skip the AOI drawing and simply paste/edit this window.

3. Then we set the following parameters:
- In this case we select Live Job, however it is recommended to select Test Query to run a test first and verify that sufficient imagery is available
- Geometric filter: set this to Contains as we want images that fully contain the AOI
- Number of images (limit): 5 - AIADS uses the most recent image as the “candidate” image and the other older images are used as historical images, so that the algorithm can detect the most significant changes based on what it has learned from the historical images.
- Cloud cover (max_cloud_cover): 20% - we don’t want too much cloud cover as they can create false anomalies and also prevent the algorithm from detecting changes in the area covered by clouds.
- Time range (time): leave this as is so that the most recent images are selected. The very most recent image will automatically be selected as the “candidate” image and the other images will become the set of “historical” or training images, that AIADS will use to compare the candidate image against.
Finally, let’s run the job:
Here’s how to set the parameters above and run our job:

4. When the job is finished, you will see the credits charged and are now able to download the results as geo tif files. As shown below, the first block (Pléiades data block) produced the imagery and the second block (AIADS processing block) produced the analyzed anomaly image from AIADS. Download the output imagery from these two completed blocks and load them into your favorite GIS to analyze and annotate further.

- You are now able to easily spot the changes from the anomaly image that AIADS has created. In this example I’ve used QGIS. Once the rasters are loaded, you can also load in other layers such as Open Street Maps.

6. Here, we look at our results to find answers. In the images above it is clear that AIADS has a “hotspot” which shows a significant change occurring between the historical images and the candidate image. We know the date range by looking at each of the satellite images’ acquisition date. You can see that a large section of forest has been cut down sometime between March 31 and June 30, 2019.
The Anomaly Image produced by AIADS (red indicates highest anomaly level) overlaying the candidate image i.e. the most recent image:
7. I used QGIS to measure the area that’s been detected and it is approximately .7 hectares. Which means that in this small region we studied, .7 hectares of Romanian forest was torn down between March 31 and June 30, 2019. From other jobs we have run, we have spotted many other areas where deforestation has also happened.
It may not seem like a large area, in this case. However, this damage appears to be an example of 1 “cut” as part of many: a classic case of “death from a thousand cuts”. Many small areas have been cut down within the surrounding forest so that the destruction is hidden.
Note that the AIADS algorithm doesn’t “judge” the deforestation in terms of authorized or unauthorized logging. We would rely on additional steps in the workflow to investigate further e.g. by checking a map of permitted regions.

8. While this is a one-time project, we now have the foundation of a system that can potentially automatically monitor thousands of AOI’s for this kind of activity. UP42 is working on supporting a data API that will notify you of new data being available. Until then, use their Catalog Search feature with a cron job or similar scheduled job mechanism to verify for new scenes as they become available, while keeping a record of existing scenes. This can be a CSV file, a key value store, or even a relational database.
So, can we answer the question: how do we detect deforestation in Romania from space?
Yes, using the steps outlined above it’s fairly straightforward to combine satellite imagery and analysis to detect deforestation in Romania that’s happened—and use this as a basis for uncovering more recent cases there, or elsewhere.
Using AIADS in combination with satellite data on UP42 allows us to monitor areas of land such as forest to know when and where an anomaly has been detected. In the case of Piatra Craiului National Park, it’s clear that deforestation that happened last year is easy to see from space and find evidence of. Now that this investigation has been established, it is possible to use UP42 to regularly monitor this and other areas, for major changes to the forest in the future.
Knowing where, when, and the scale of environmental damage occurring is key to protecting it. We’re now able to use this information to compare and contrast with local regulations, national laws, industry statistics, and other data that provides context to understanding the changing environment.


