


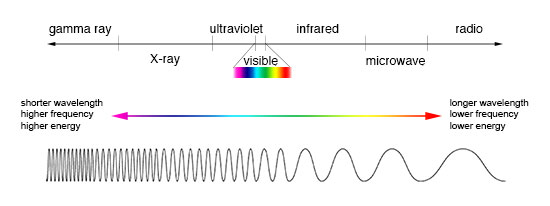
Of the total energy radiated by objects around us, we can only see a small part. Our eyes can only perceive the visible range of the electromagnetic spectrum.
While the visible range enables us to sense colors, it can sometimes be limiting.
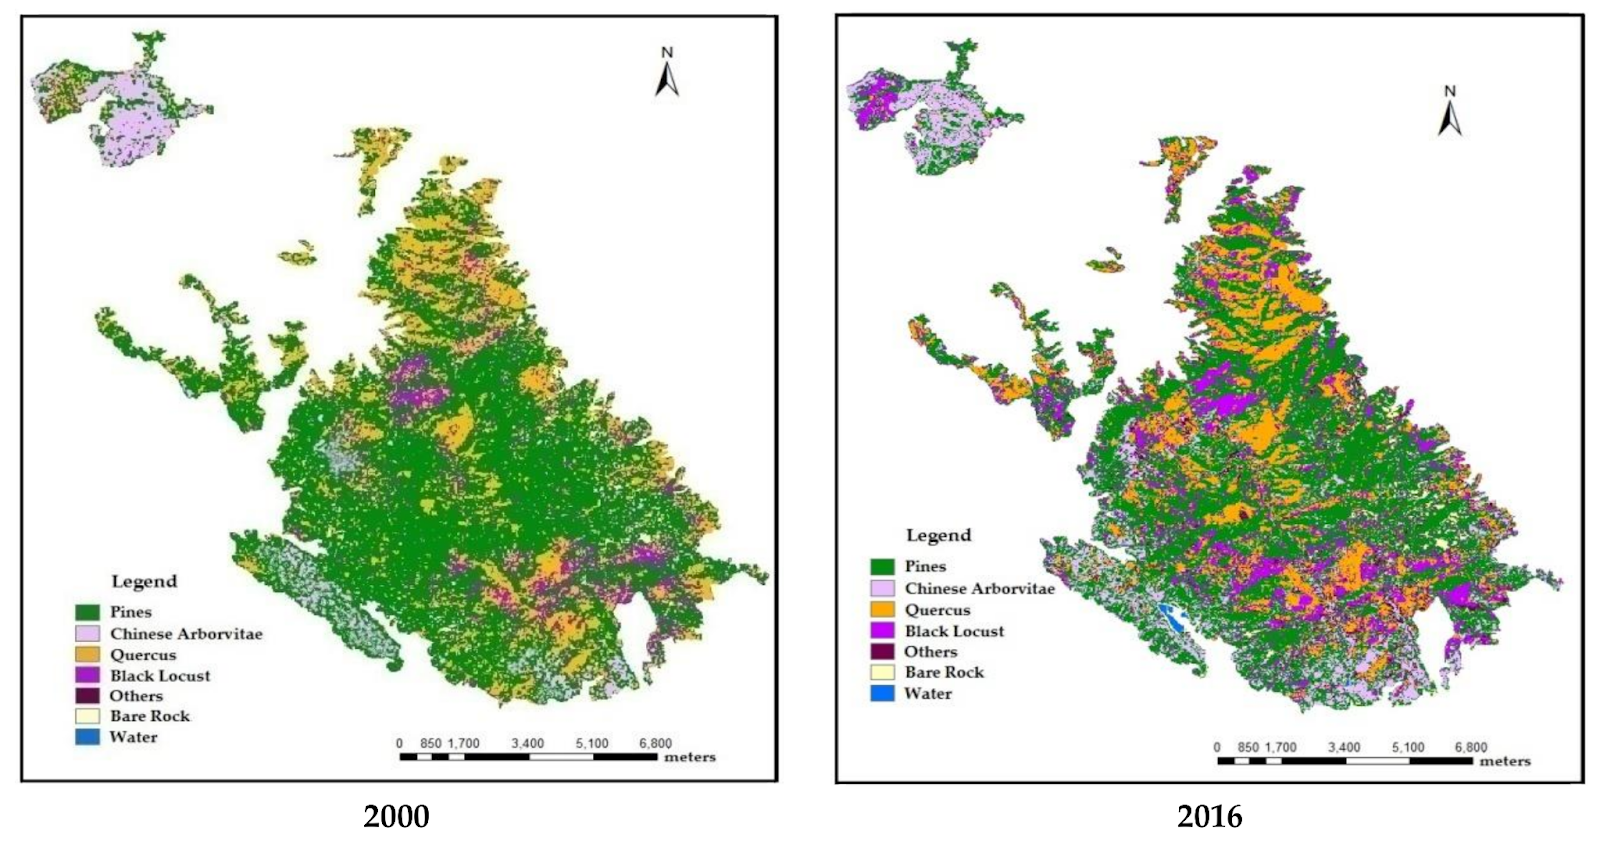
For example, consider the two satellite images below captured in a mountainous area over two different periods.

From a visual inspection, we can infer that the site has vegetation cover because of the green color. However, we cannot distinguish the vegetation species–let alone detect changes in their distribution between the two years. This is because different vegetation species have almost similar reflectance within the visible range of the electromagnetic spectrum: they reflect green light.
Beyond the visible range, however, vegetation species have different reflectance characteristics making them easier to differentiate. In this example, therefore, using reflectance characteristics of vegetation beyond the visible range allows us to classify different tree species and examine changes in their distribution (as in the maps below).
The above example demonstrates one of the advantages of being able to see beyond the visible spectrum. Luckily, we do not have to depend on our eyes for this.
Some satellite sensors can detect visible and nonvisible portions of the electromagnetic spectrum. Such sensors are called multispectral or hyperspectral sensors, and the resulting images are multispectral or hyperspectral imagery.
This article explores the role of multispectral and hyperspectral imagery in helping us see beyond the visible.
What is multispectral imagery?
Multispectral imagery is imagery containing multiple spectral bands of the electromagnetic spectrum. They are collected by sensors that measure reflected energy in specific portions of the electromagnetic spectrum.
Most multispectral imagery contains 4–12 bands in the visible to the infrared portions of the electromagnetic spectrum. According to a USGS report, multispectral images may contain up to 36 wavelength bands.
We can display multispectral imagery one band at a time as a monochrome image, or in combination as a color composite.
A quick refresher on the electromagnetic spectrum
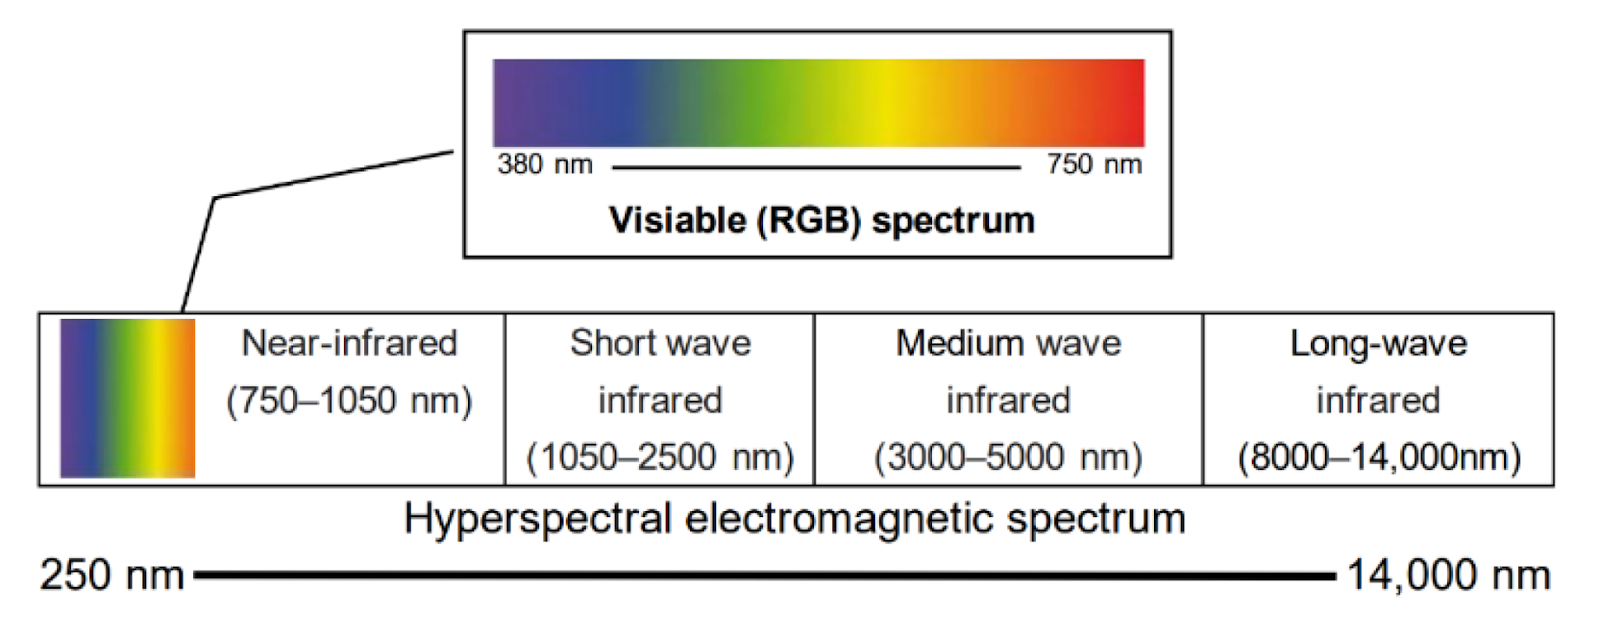
The electromagnetic spectrum is the entire range of wavelengths of electromagnetic radiation. For analytical purposes, the electromagnetic spectrum is divided into bands (portions), each representing a range of wavelengths. We refer to the bands by name: gamma rays, x-rays, ultraviolet rays, visible light (0.4µm--0.7µm), infrared (0.7µm--100µm), microwaves (1mm--1m), and radio waves.
The visible portion–what we perceive with our eyes–is further segmented into blue, green, and red regions. Similarly, the infrared band is segmented into near-infrared, mid-infrared, and far-infrared regions.
Different portions of the spectrum are relevant for providing information about various features on the Earth's surface. But we first have to identify which band or bands to use. Which calls for an understanding of spectral signatures.
What do we mean by spectral signature?
Spectral signature is the amount of incident energy reflected by a material over different portions of the electromagnetic spectrum. We usually represent spectral signatures as a graph (a spectral response curve) showing the variation in reflected energy across different wavelengths.
The graph below is an example of a spectral response curve showing the spectral signatures of different materials.

Note: The spectral signature of an object is not constant. It varies based on, among other things, the physical properties of the material, atmospheric effects, and the sensor's view angle. Therefore, spectral response curves are sometimes drawn as shadings–as opposed to a thin line–to show variability.
Why are spectral signatures important in remote sensing?
Spectral signatures help to identify different objects in remotely sensed imagery.
For example, from the spectral response curve above...
-
Vegetation reflects more green light in the visible portion and has the highest reflectance in the near-infrared band.
-
Bare soil exhibits a gradual increase in reflectance in the visible and near-infrared bands.
-
Water has a lower reflectance as compared to vegetation and soils with more reflectance in the visible portion.
Therefore, understanding the spectral response characteristics of different features facilitates their identification.
Further, examining spectral response characteristics aids in the development of indices that are used to quantify various feature characteristics. An example is the Normalized Difference Vegetation Index (NDVI) used for determining areas with vegetation cover and evaluating their condition.
Pleiades Neo is a good example of a powerful multispectral sensor.
What is hyperspectral imagery?
Hyperspectral imagery contains hundreds of wavelength bands collected in narrow, adjacent sections across the visible and infrared regions of the electromagnetic spectrum. The USGS classifies images with 37+ bands as hyperspectral images.
The advantage of hyperspectral remote sensing lies in the acquisition of an almost continuous reflectance spectrum for each pixel in an image. The narrow bands enable the detection of slight differences in features, which would otherwise be undetected using the relatively broad wavelength bands of multispectral imagery.
Hyperspectral imagery, therefore, improves the identification and quantitative assessment of the physical and chemical properties of the objects of interest, e.g., vegetation, water, soils, minerals, etc.
Examples of hyperspectral satellites
The following table contains examples of hyperspectral sensors, along with details such as number of bands, swatch, and resolution.

Update to the above table: EnMAP satellite was successfully launched on April 1, 2022.
What is the difference between multispectral and hyperspectral imagery?
The major difference between multispectral and hyperspectral images is the number of bands within the same portion of the electromagnetic spectrum.

The table below summarizes the differences.
| Multispectral imagery | Hyperspectral imagery | |
|---|---|---|
| Number of bands | Typically 5-12 bands. Can go up to 36 bands (USGS). | Above 37 bands (USGS). |
| Bandwidth | 50-200 nanometers wide. | 1--15 nanometers wide. |
| Sensitivity to subtle spectral variations | Non-continuous spectral sampling in a few discrete bands. Limits the detection of subtle changes in absorption properties of features. | Almost continuous spectral sampling. Enables the extraction of unique absorption properties of features within narrow bands-allowing for the detection of subtle spectral changes. |
What is multispectral imagery used for, and where does hyperspectral imagery come in?
Multispectral imagery is useful for the differentiation of vegetation types, soils, water, and human-made structures. Owing to their higher spectral resolution, hyperspectral imagery enables a finer scale distinction of features. Hyperspectral imagery is especially useful for uncovering spectral details which cannot be detected by multispectral sensors.
In this section, we look at the applications of multispectral imagery and point out where hyperspectral imagery might come in. In a bid to show the importance of different portions of the electromagnetic spectrum, we outline those that are relevant for each application.
We group the applications based on the phenomena of interest, namely vegetation, soil, water, and rocks/ minerals.
Vegetation applications
When light hits vegetation, reflection, absorption, or transmission occurs. These are influenced by the leaves' chemical, structural, and biological properties. This interaction between plants and light enables the discovery of plant properties. In summary:
-
Healthy plants absorb ultraviolet light (100--400 nm)
-
Vegetation appears green because it reflects the visible green portion of the electromagnetic spectrum but absorbs the visible red and blue portions
-
Leaf pigments like chlorophyll influence reflectance in the visible range (400--700 nm)
-
The structure of leaf cells affects reflectance in the near infra-red region (700--1000 nm)
-
Plant water content and biochemistry (e.g., protein and cellulose content) influences reflectance in the shortwave infrared region (1000--2500 nm)

The above spectral response characteristics aid in the development of vegetation indices, which are useful for the extraction of vegetation traits from multispectral and hyperspectral data. They also give rise to the following applications of multispectral and hyperspectral imagery for vegetation analyses.
Multispectral imagery for vegetation species classification
The spectral response pattern differs among different plant species enabling species recognition using remotely sensed imagery.
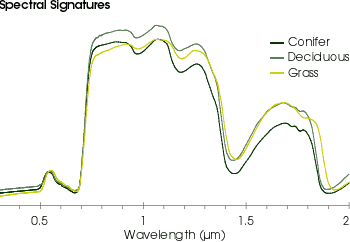
For example, the graph below shows the spectral response patterns of conifer, deciduous, and grass vegetation. While their reflectance in the visible range is almost alike, they display different reflectance patterns in the near-infrared range enabling their classification.
Multispectral imagery for detection of plant health and stress
For vegetation, the rate of increase in reflectance is the highest in the region between the visible red and near-infrared bands. This region is known as the red edge band.
The red edge band is an important indicator of plant health and stress. How does this work?
When a plant is unhealthy or under stress, it produces less chlorophyll. Less chlorophyll means higher reflectance in the visible red region (chlorophyll absorbs visible radiation, especially in the blue and red wavelengths). At the same time, as the water content in leaves decreases, reflectance in the near-infrared region increases. These changes alter the position and shape of the red edge band.
For example, the image below illustrates changes in the shape and position of the red-edge band for plants at three different levels of water stress.

Find out how you can leverage the red edge band to detect vegetation stress early in the plant growth cycle.
Where does hyperspectral imagery come in?
Hyperspectral images contain more information on subtle spectral features of vegetation than multispectral images. They are thus useful for discriminating between plant varieties, detecting vegetation stress, and even estimating biomass in higher detail.
Additionally, in some cases, the construction of vegetation indices using the narrow bands of hyperspectral imagery yields better estimates of biophysical parameters (e.g., biomass and leaf area index) than vegetation indices derived from multispectral imagery.
Soil applications
The spectral reflectance of soils varies by their physical and chemical properties. These interactions give rise to multispectral data applications for studying soil properties like moisture content, organic matter content, iron content, texture, roughness, and mineral composition.
Multispectral images for determination of soil moisture content
Soil moisture estimation is important in agriculture, hydrological and carbon cycle studies, among others.
Soil reflectance in the visible wavelengths decreases with increasing soil moisture up to the point of saturation---where there is no more change. Similarly, soil reflectance in the near-infrared region decreases with increasing moisture. These reflectance characteristics allow for the determination of moisture content using multispectral bands.

Multispectral images for determination of soil organic matter content
Determination of soil organic matter content is important for soil management, estimation of available nutrients for precision agriculture, and climate variability studies.
Studies have shown that soil reflectance properties in different multispectral bands can be used to estimate soil organic matter. For example, an increase in organic matter (even amounts only exceeding 2%) has a significant effect on soil reflectance. Specifically, organic matter reduces overall soil reflectivity up to an organic matter content of 5% beyond which there is no more change.
Water applications
Water only reflects up to approximately 10% of incident energy. Of these, most are in the visible portion of the electromagnetic spectrum, with little or no reflectance in the near-infrared region.
That said, depending on water characteristics like depth, suspended sediments, and aquatic vegetation, water bodies have unique reflectance properties. Multispectral imagery is thus useful in examining these variable water environments.
One area of application is in the determination of water quality.
Water quality is assessed using several indicators including dissolved minerals, suspended material, bacteria levels, oxygen levels, salinity, etc. These indicators affect the optical properties of water in the visible and near-infrared portions, and their identification can therefore benefit from remote sensing techniques.
For example, the video below shows how Landsat 8 multispectral imagery helped scientists identify algal bloom in Lake Utah:

Aside from water quality, multispectral imagery also supports the monitoring of ocean environments. Discover why satellite imagery is the key to ocean monitoring.
Mining applications
There are lots of rocks and minerals on the surface of the earth. Each has unique reflectance properties determined by color, texture, chemical composition, etc.
Multispectral imagery plays a vital role in the initial stages of mineral exploration: enabling discrimination and mapping of different rocks and minerals based on their reflectance in the visible and infrared portions of the spectrum.
Aside from mineral exploration, multispectral imagery also facilitates the environmental monitoring of mining areas. Discover how geospatial technology enables mine operators to protect the environment and plan remediation throughout the mine lifecycle.
Where does hyperspectral imagery come in?
Because of their broad spectral bands, multispectral imagery is limited in the detailed classification of rocks and minerals---not to mention estimating the distribution of mineral constituents within a pixel.
The application of fine spectral resolution hyperspectral images, however, enables the identification of a large range of minerals and allows for the determination of their composition and abundance.
For more stories on the applications of multispectral images, check out our blog.
Go beyond the visible: Explore the full spectrum
Human vision is constrained to the visible portion of the electromagnetic spectrum. Remote sensing systems, however, provide the opportunity to measure beyond the visible and into the full spectrum.
Multispectral and hyperspectral images reveal insights about our changing world beyond our human experience. They tell us about the mineral composition of the soil, biomass and plant health, surface roughness, vegetation types, ocean temperatures, and so much more.
Where can you find these images? Right here on UP42.
Explore our range of multispectral and hyperspectral images.


