


Temperature is key to answering questions like: Where have forest fires flared up? Which crops are water-stressed? Which areas are prone to droughts? Which areas experience urban heat island effects? When is key energy infrastructure operating at full capacity? And how do sea surface temperatures vary? In addition, temperature information plays a key role in climate change studies. In this regard, thermal imagery and derived products are a crucial source of information.
Satellite-based observations offer the advantage of large-area coverage at regular intervals. Unfortunately, thermal satellite imagery is generally scarce. Few satellites collect images in thermal bands. These include NASA's Terra and Aqua, Landsat 7 and 8, and Copernicus Sentinel-3.
However, recent developments in satellite thermal sensors stand to improve the availability of thermal imagery. For example, thermal infrared imagery from OroraTech and SatVu offer high temporal resolutions and hold great potential for various applications.
In view of this, we focus on thermal imaging satellites, how they work, and their applications.
Demystifying thermal radiation: What is thermal imaging?
Any object with a temperature above absolute zero (0K or -273°C) emits electromagnetic radiation. The emitted radiation depends on the object's material type and temperature. Thermal imaging entails measuring the emitted radiation in the thermal infrared (TIR) region of the electromagnetic spectrum.
Thermal remote sensing methods collect TIR data without direct contact with the objects. Thermal imaging satellites fall under thermal remote sensing.
Thermal infrared on the electromagnetic spectrum
The electromagnetic spectrum is the range of wavelengths or frequencies of all electromagnetic radiation.
In remote sensing, electromagnetic waves are categorized into regions. Different regions are assigned names like visible, infrared, and microwave based on their wavelengths, as shown in the figure below. The wavelengths are measured in micrometers (µm), whereby one micrometer equals 10 to the power of -6 m.
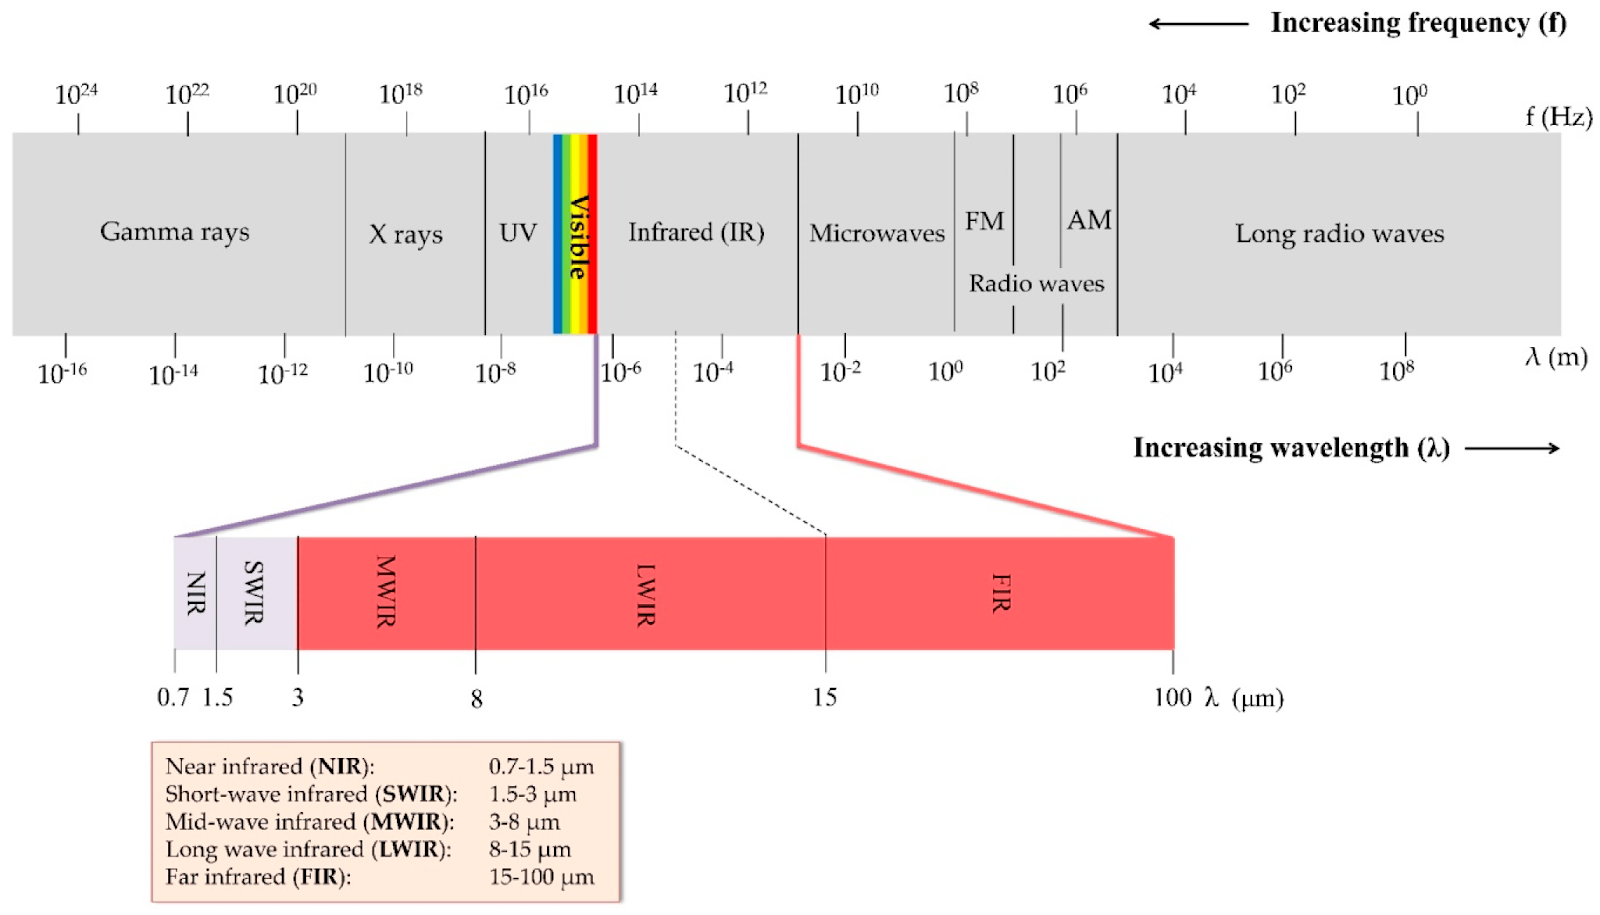
The infrared portion of the spectrum is divided into:
-
Near-infrared (NIR): 0.7-1.5 µm
-
Short-wave infrared (SWIR): 1.5-3 µm
-
Medium-wave infrared (MWIR): 3-8 µm
-
Long-wave infrared (LWIR): 8-14 µm
-
Far-infrared (FIR): 14 µm-100 µm
Which is the thermal infrared region of the electromagnetic spectrum?
The thermal infrared (TIR) region extends from 3 μm to 14μm. It comprises medium-wave infrared (MWIR) and long-wave infrared (LWIR) wavelengths.
The 3-5 μm and 8-14 μm wavelengths are the most commonly used in thermal infrared remote sensing.
Why?
First, at their ambient temperature, Earth surface materials, like soil, water and vegetation, emit in the LWIR (8 μm to 14 μm) region.
Second, as objects are heated above the ambient temperature, the emitted radiation shifts to shorter wavelengths. Therefore, the 3 µm to 5 µm wavelengths in the MWIR region help to detect hot surfaces, e.g., due to forest fires.
Finally, and perhaps more importantly, these wavelengths include an atmospheric window.
What do we mean by an atmospheric window?
The atmospheric window refers to the spectral intervals of the electromagnetic spectrum, where radiation is transmitted without significant interference from the atmosphere.
The Earth's atmosphere contains different molecules including ozone (O3), water vapour (H2O), and carbon dioxide (CO2). These molecules absorb electromagnetic radiation, decreasing the radiation reaching the sensor. The wavelengths where almost all radiation is absorbed by atmospheric gasses are not useful for remote sensing of the Earth's surface.
Ultimately, only portions of the spectrum outside the main absorption ranges are optimal for remote sensing. Such portions are referred to as atmospheric windows.
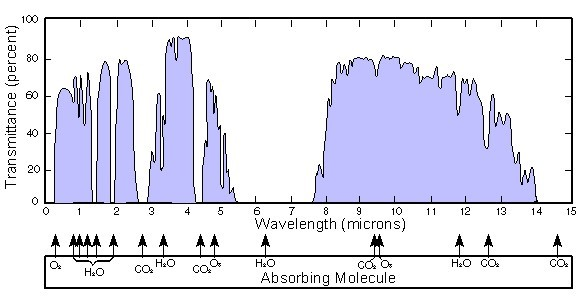
In the image above, dips in the curve indicate absorption by the atmosphere. Within the TIR region, we can see that:
-
The 3-5 µm portion is lightly affected by atmospheric absorption.
-
Almost all of the radiation between 5 µm and 8 μm is absorbed by atmospheric gasses (i.e., water (H20), carbon dioxide (CO2), and ozone (O3) molecules).
-
The 8-14 µm portion is lightly affected by atmospheric absorption.
Therefore, in the TIR region, we can say that there are atmospheric windows at 3 µm to 5 µm and 8 µm to 14 µm.
How is thermal infrared different from near-infrared and shortwave infrared radiation?
NIR and SWIR radiation have shorter wavelengths of between 0.7 µm and 3 µm. They represent the reflectance of incoming sunlight by surface objects and may be referred to as reflected infrared.
TIR radiation, on the other hand, has wavelengths longer than 3 µm. It represents the energy emitted by surface objects—rather than reflected energy—and may be referred to as emitted infrared.
Unlike reflected infrared, TIR radiation causes a heat sensation. It is measured as surface temperature.
TIR radiation is collected independently of the sun. This means thermal imagery can be acquired during the day and night. Meanwhile, reflected infrared depends on sunlight and is thus usually collected during the day.
Is there an optimal time to collect thermal satellite imagery?
No. The selection of the optimal time for acquiring thermal data depends on the application.
For example, nighttime thermal data—especially predawn data—are usually preferred in detecting thermal anomalies. This is because the effects of daytime uneven solar heating are minimal. Pre-dawn thermal imagery also enables easier detection of weak anomalies like those induced by underground coal fires.
Is thermal satellite imagery affected by clouds?
Yes. Infrared wavelengths cannot penetrate clouds. Clouds contain water droplets which absorb infrared radiation.
As such, consistent land temperature retrieval using thermal satellite images is limited In regions frequently covered with clouds.
Is thermal satellite imagery affected by smoke?
No. Infrared radiation can penetrate smoke, making thermal satellite images valuable for monitoring and tracking fires.
Why do thermal bands generally have lower spatial resolution than optical bands?
Optical satellite images are gathered in the visible, NIR, and SWIR wavelengths, whereas thermal images utilize TIR signals.
Now, the wavelength of a signal is inversely proportional to its energy. In other words, the longer the wavelength, the lower the energy, and vice versa. TIR radiation has longer wavelengths than visible, NIR, and SWIR radiation. Therefore, TIR signals have lower energy than reflected radiation.
Enough energy has to reach the detector to make measurements. This is especially important because at their ambient temperature, Earth features emit in the LWIR region, and the longer wavelengths mean less energy. Consequently, the detector elements must be large enough to capture sufficient energy to meet the signal-to-noise ratio requirements.
In short, the sensors must view large areas of the Earth's surface to obtain detectable thermal infrared radiation. The larger detector elements result in thermal bands having a coarser spatial resolution than optical bands.
What is the value of high spatial resolution thermal satellite imagery?
High spatial resolution thermal imagery helps to attribute temperature values to specific features. This is especially useful in heterogeneous landscapes like urban areas.
A high spatial resolution image pixel captures a smaller area. In urban areas, this enables the discrimination of fine-scale features like green spaces, water bodies, and buildings and their corresponding temperatures.
On the other hand, a low spatial resolution image pixel captures temperature over a larger area. The mixed pixels make it challenging to discriminate the temperature of different components in heterogeneous regions.
How are thermal satellite images represented visually?
Unlike visible radiation, our eyes are not sensitive to thermal radiation. There is, thus, no "natural" way to represent thermal images. As such, thermal images can be represented in different ways.
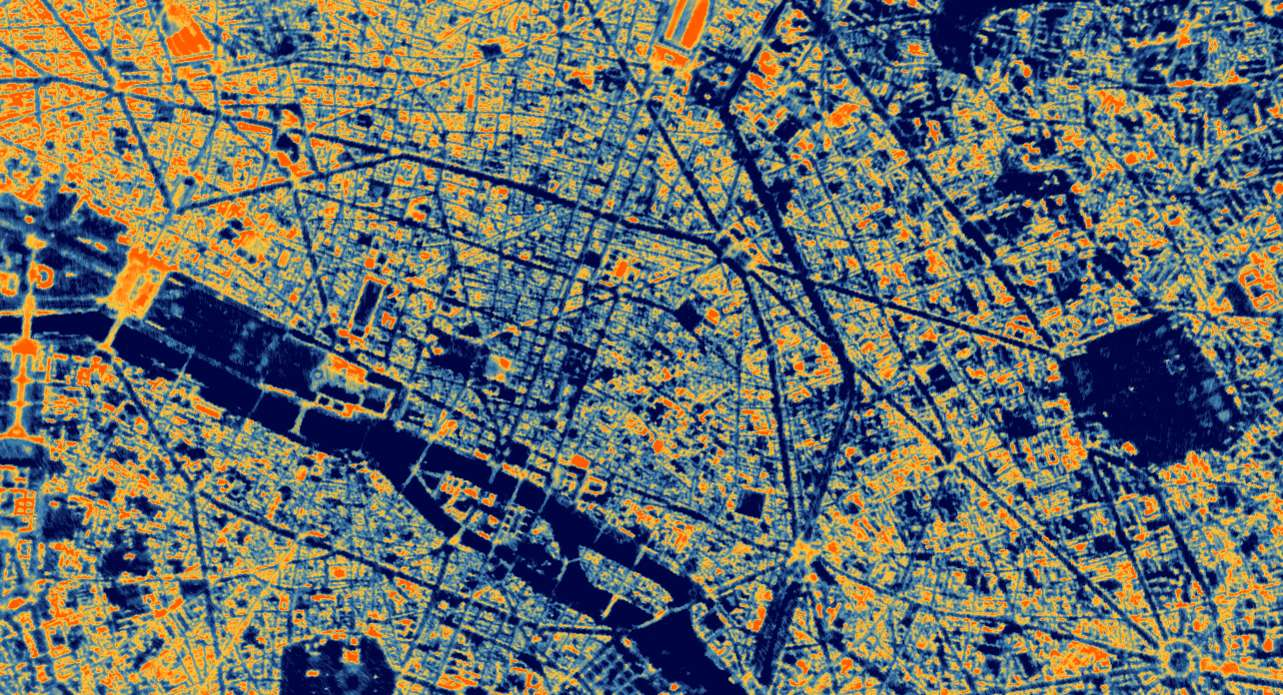
For instance, as grayscale images: darker areas represent cooler temperatures, while lighter tones represent warmer temperatures. Another option is using colored images ranging from blue to red. The image on the left is an example of the latter option.
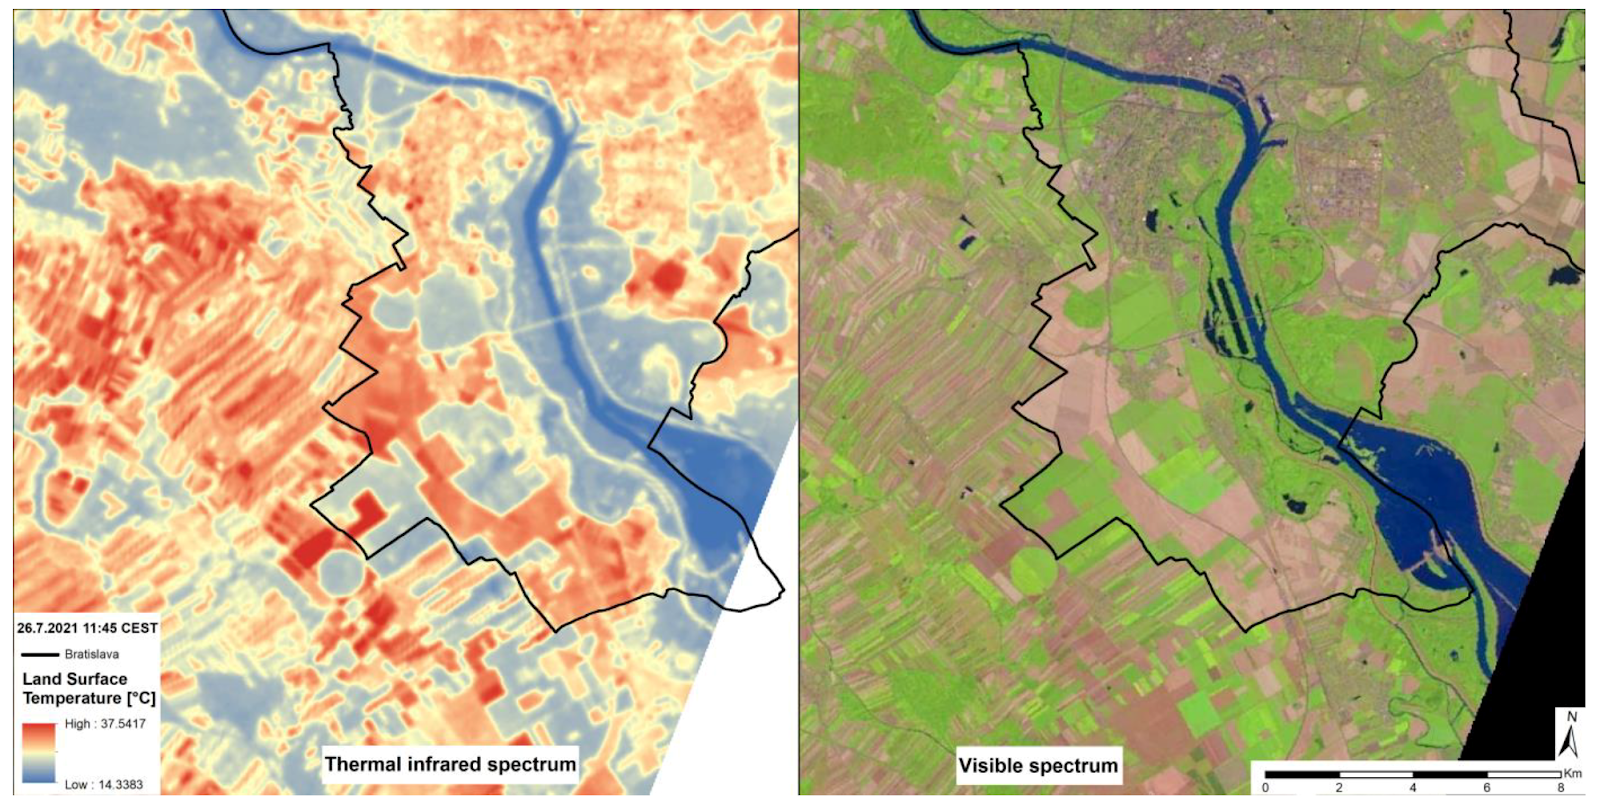
In the thermal infrared image above (left), we can see temperature variations over urban surfaces that are not noticeable in optical imagery (right). At the same time, the optical imagery helps us infer that vegetated areas experience lower temperatures than non-vegetated areas. The image illustrates the complementarity of thermal and optical bands when interpreting temperature variations.
We explore more applications of thermal satellite images below.
Applications of thermal satellite imagery
Application1: Thermal imagery in climate monitoring
According to the Intergovernmental Panel on Climate Change (IPCC), global surface temperatures have continued to increase. More intense and frequent wildfires, droughts, and heat waves are some of the consequences of global warming. There is an urgent need for actions to combat climate change and its impacts.
Land surface temperature (LST) and sea surface temperature (SST) are among the essential climate variables used to assess the impact of climate change. They facilitate the understanding of the Earth's weather and climate patterns.
Thermal infrared satellites enable LST and SST measurement at regional and global scales. They enable consistent monitoring and complement in situ measurements for tracking surface temperatures. Ultimately, satellite thermal imaging supports policy-making for combating climate change.
Application 2: Thermal satellite imagery in precision agriculture
Precision agriculture is concerned with optimizing farm inputs for maximum productivity. It entails integrating various tools and technologies to inform the rates of inputs based on site-specific information.
Thermal images provide temperature estimates of the soil and crop surfaces for various applications in precision agriculture, including:
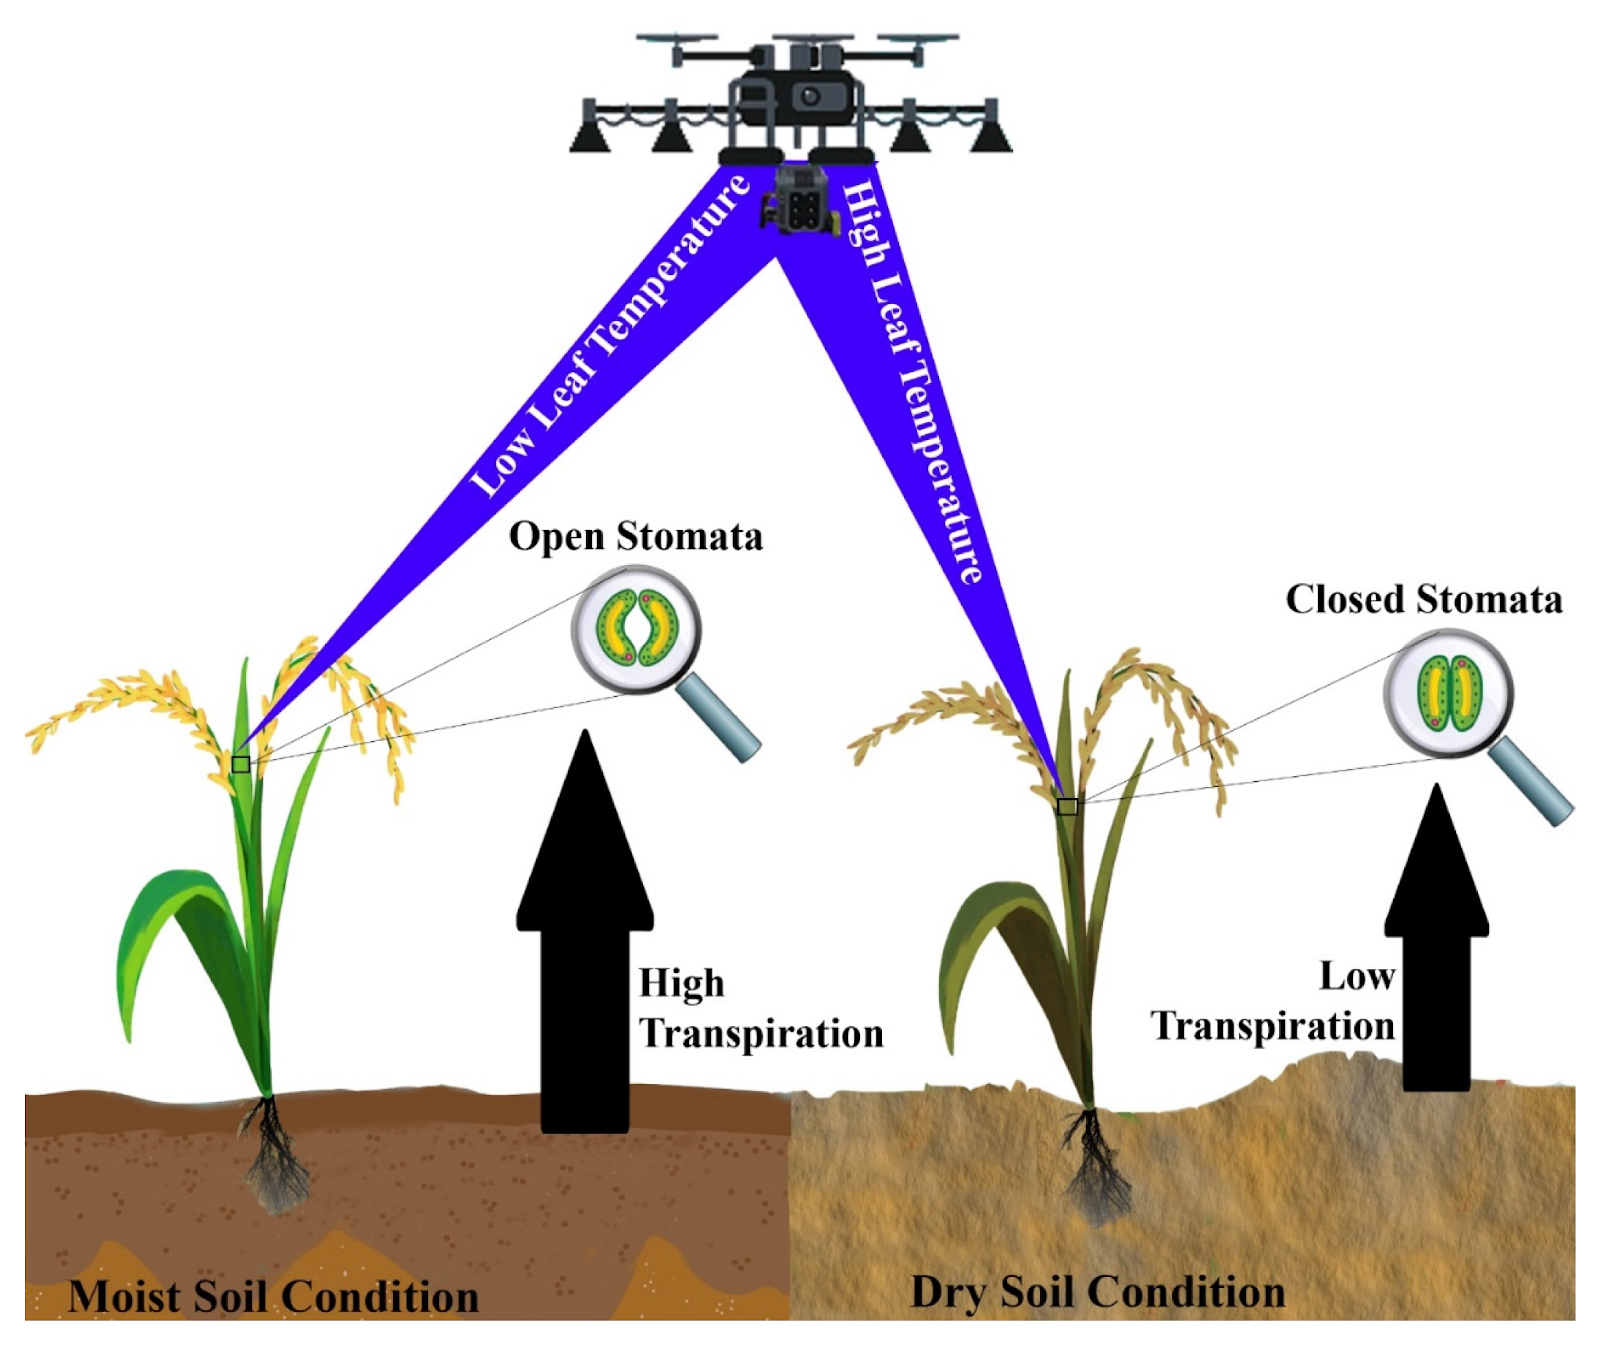
- Irrigation scheduling: Efficient irrigation scheduling helps to conserve fresh water. At the same time, it ensures that the soil moisture is adequate to sustain crop growth. Otherwise, the crops end up water-stressed, reducing yields. Temperature variations in thermal images can provide information on moisture-stressed crops.
When a leaf transpires, it cools relative to the surrounding air. However, as water becomes scarce, transpiration reduces and the leaf temperature increases. Therefore, water-stressed plants experience higher leaf temperatures than non-stressed vegetation. Thermal images can detect the rising canopy temperatures to inform optimal irrigation timing.
- Crop health assessment: Plant diseases can impair water absorption and transpiration, leading to a warmer plant canopy. Differences in plant canopy temperatures serve as indicators of crop health.
While vegetation indices like the normalised difference vegetation index (NDVI) can detect changes in greenness caused by plant stress, thermal images can help to catch these early, i.e., when the plants are still green.
This is why companies like ConstellR use high-resolution LST data to inform agricultural practices. They provide field-level insights on crop health and water stress for irrigation scheduling and yield prediction. Overall, the insights support water conservation and agricultural production in a changing climate.
Application 3: Thermal imaging in detecting and monitoring wildfires
The increasing frequency and severity of wildfires highlight the need for effective wildfire management strategies. Early wildfire detection is pivotal to mitigating their impacts. Thermal satellite images are at the center of these efforts.
Thermal anomalies or an unexpected increase in the temperature value of a pixel relative to its neighbors is the basis for identifying wildfires.
Active fires emit more strongly in the MWIR (3--5 μm) than the LWIR (8-14 μm) wavelengths. This is due to the relatively higher temperatures. The cooler surrounding objects emit more strongly in the LWIR region. The higher signals in the 3--5 μm wavelengths form the basis of most active fire detection algorithms.
The startup OroraTech is harnessing the power of thermal radiation to detect wildfires. Their FOREST-2 thermal sensor captures the Earth's temperature and relays the data in near-real-time to enable timely wildfire detection and monitoring.
FOREST-2 is among their planned constellation of sensors aimed at global temperature monitoring every 30 minutes. The improved resolution offers the potential for early estimation of fire perimeters which can support fire monitoring and management in near real time.

With the rising temperatures, wildfires continue to be a pressing issue. Prevention and management calls for early detection of hotspots. Thermal infrared satellites are an essential tool towards these efforts.
Discover how satellites can be used in wildfire response.
Application 4: Thermal imaging in detecting urban heat islands
Pavements, concrete, and other non-vegetated surfaces are some factors that lead to higher temperatures in urban areas as compared to surrounding non-urbanized areas. This phenomenon is called the urban heat island effect.
According to the United States Environmental Protection Agency (EPA), urban heat islands cause reduced air quality, higher air conditioning costs, and heat-related illnesses. Global warming and rapid urban growth continue to exacerbate the problem. There is a need for targeted efforts towards lowering urban temperatures.
Land surface temperatures derived from thermal satellite images can enable the identification of urban heat islands. Urban areas consist of heterogeneous surfaces. High spatial resolution images are thus needed to derive fine-scale temperature changes for targeted interventions.
However, the spatial resolution of existing satellites has limited such fine-scale analysis. For example, Landsat thermal bands have a spatial resolution of 30m. SatVu aims to fill this gap by providing high spatial resolution imagery, with their next satellite launch scheduled for 2025. The resulting insights could inform interventions for mitigating the impact of urban heat islands.
Access thermal satellite imagery today
From precision agriculture to disaster response, thermal satellite imagery provides vital insights about the Earth's surface. However, thermal satellites are limited in number as compared to optical satellites. But this is changing.
OroraTech and SatVu have launched thermal satellites, increasing the available thermal imagery on the market today, with Ororatech available for tasking and archive and SatVu available for archive.
Want to access the datasets? Head into your UP42 account to try out the new datasets.
Want more information, or want to talk about your desired use case? Get in touch with us today.


