Track forest fires with satellite imagery: The normalized burn ratio and other techniques
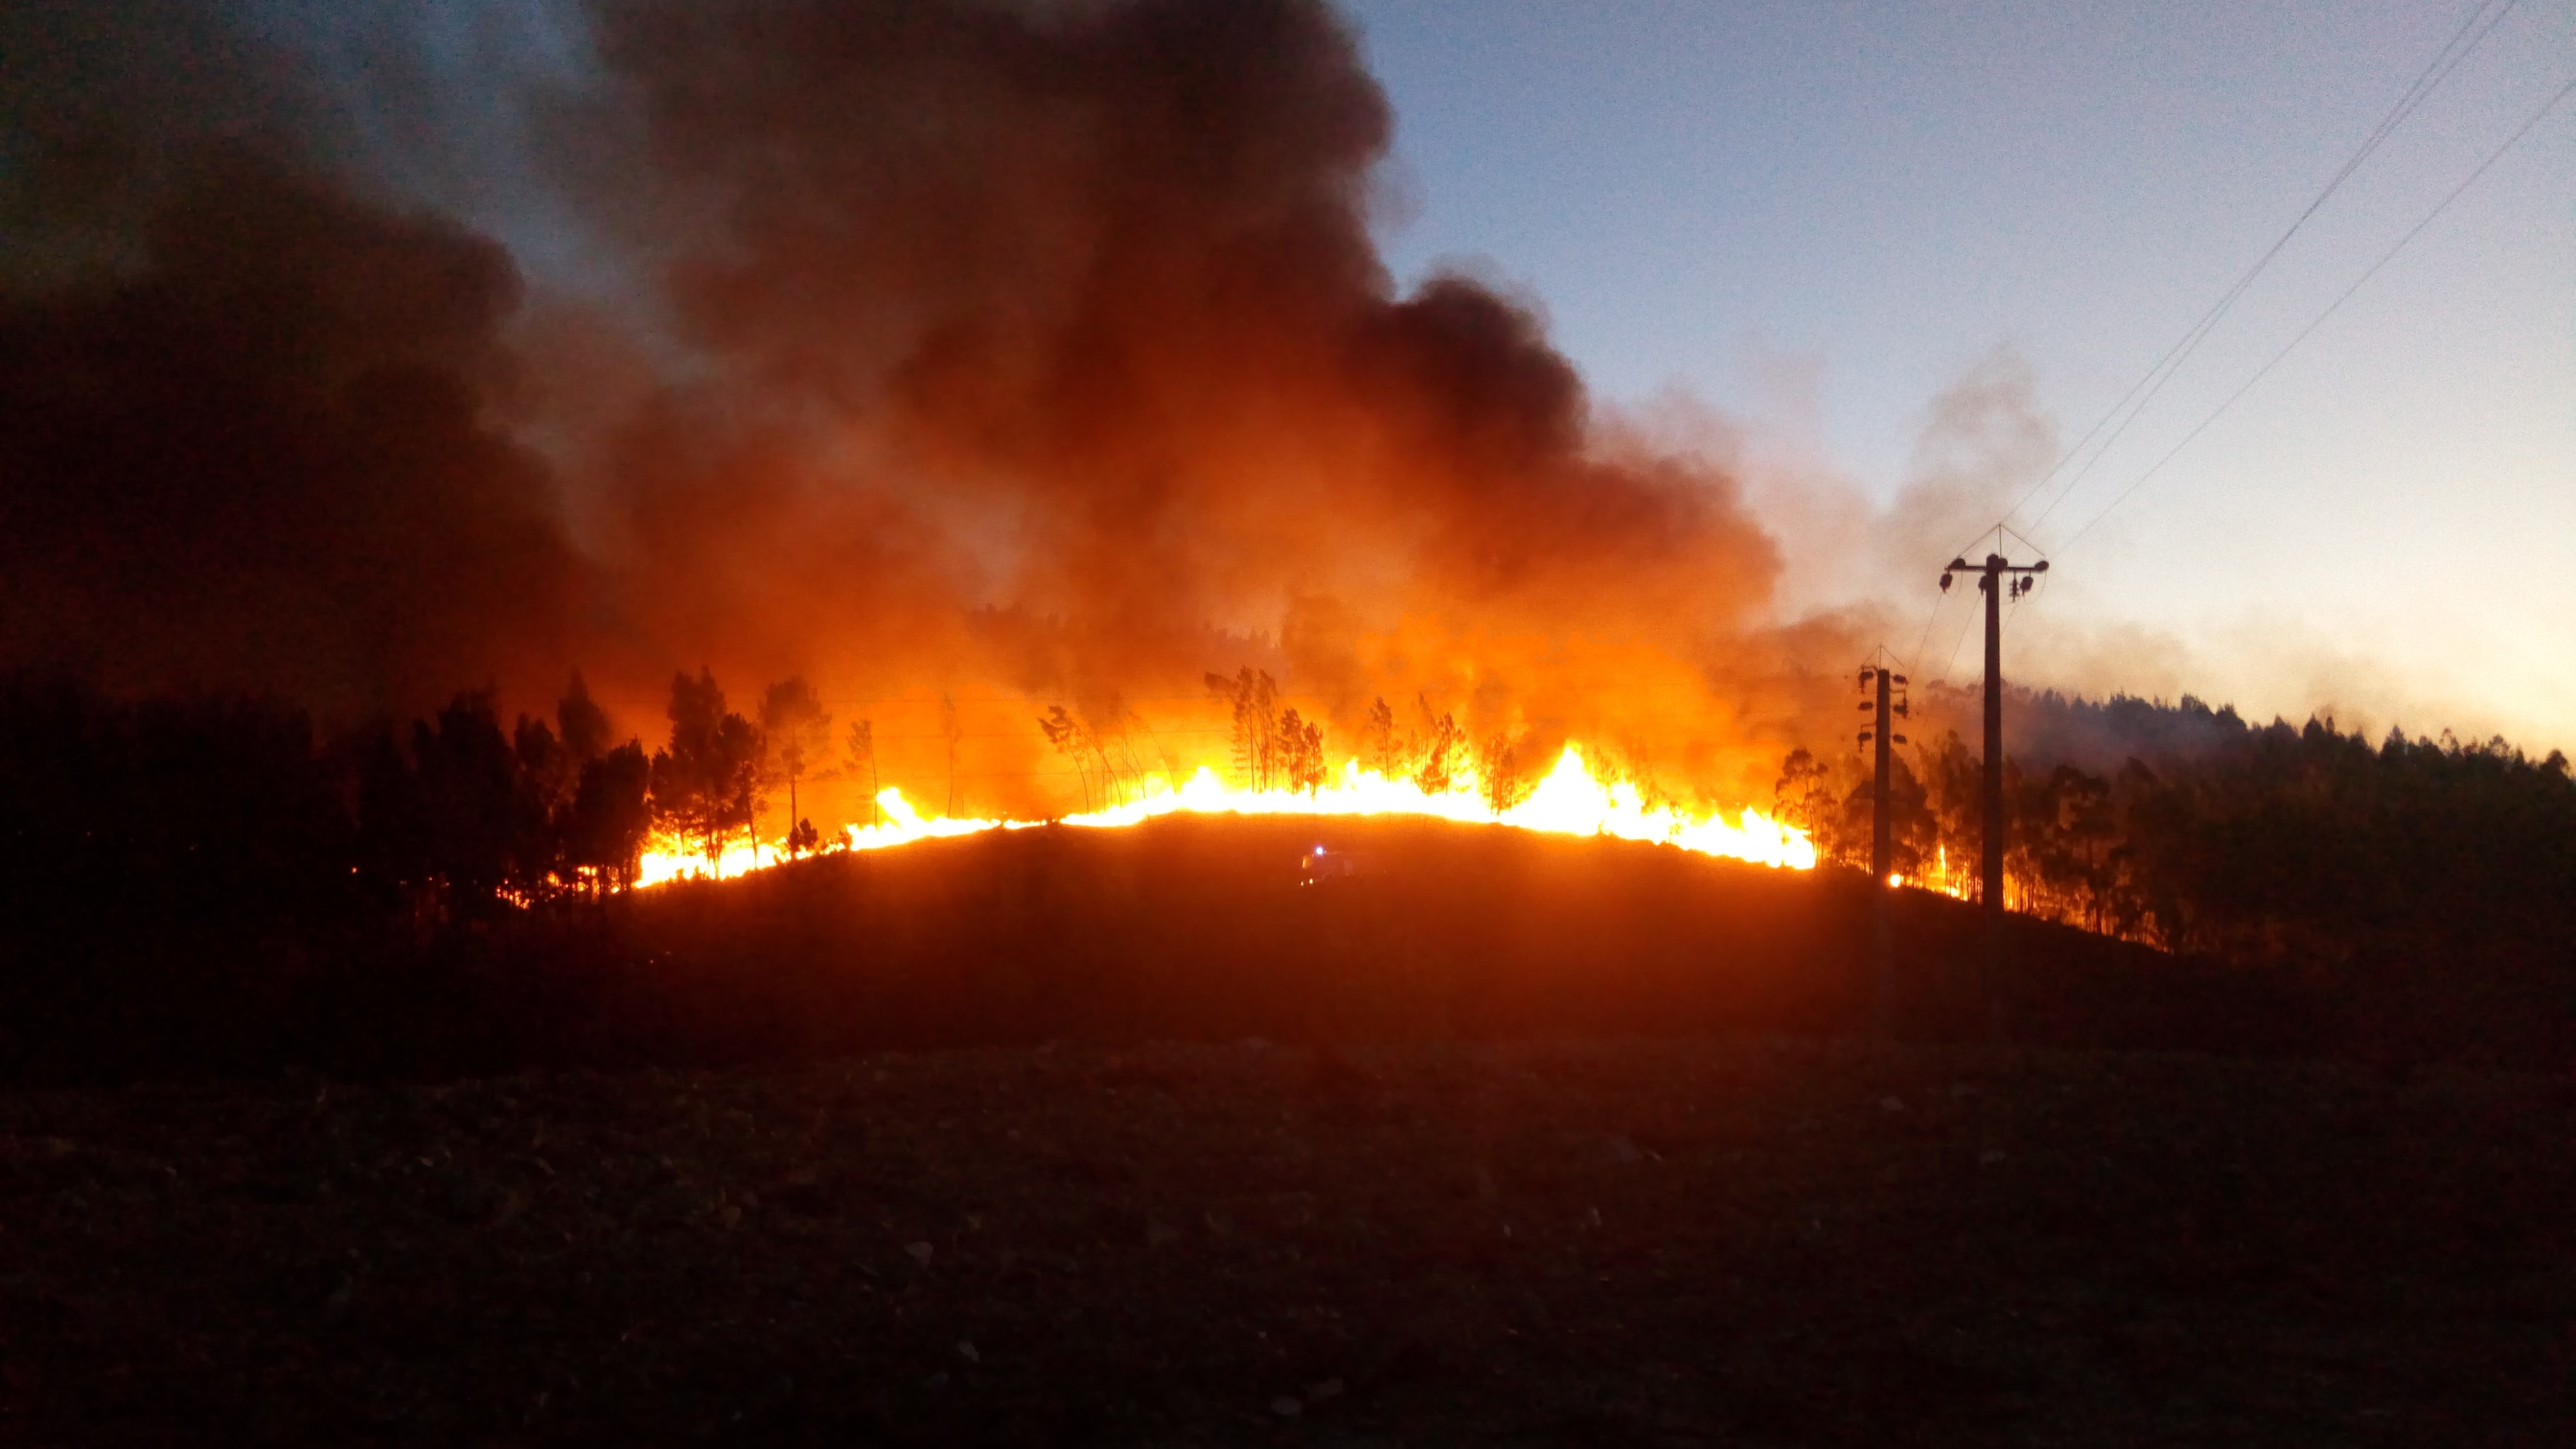
Wildfires. Large unplanned fires that occur and spread through various landscapes including forests, grasslands, and rangelands.
Wildfire season is defined as the period between the first large fire and the last large fire of the year, and usually occurs between May and October. But this is changing. Due to climate change, wildfire season is projected to increase in frequency and severity.
One consequence is increased forest cover loss. Today, fires result in the loss of 3 million hectares of tree cover—akin to burning the approximate land area of Belgium.
While forest fires can help to clear dead material, and promote new growth, they can be detrimental. Wildfires pose a risk to human life and wildlife, destroy habitats, cause hydrological changes, increase soil erosion, and threaten economies. They also trigger greenhouse gas emissions, which affect air quality and exacerbate climate change.
Therefore, there is a need for early detection, monitoring, and assessment of wildfire impacts. Timely and frequently updated information is essential for improving our understanding of wildfire drivers, fire management, and air quality forecasting.
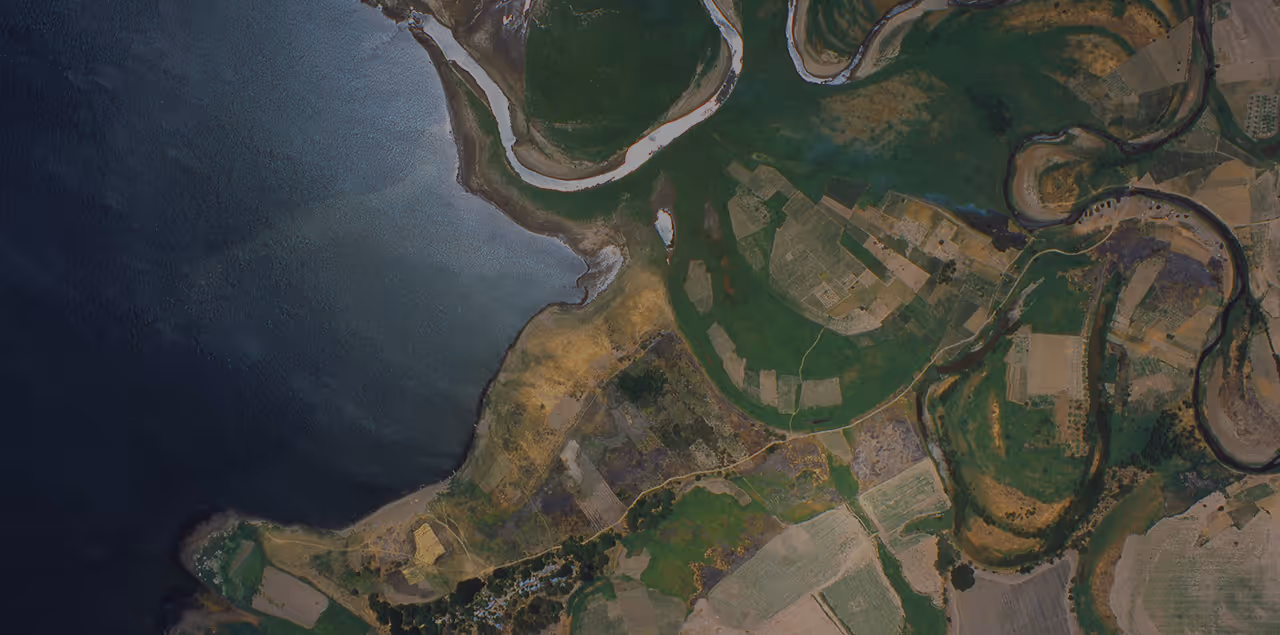
Satellite images facilitate forest fire monitoring at global, regional, and local scales. They offer the advantages of large spatial coverage, consistent data collection, and lower costs than ground methods. As such, satellite imagery has been used to measure fire risk, detect burn areas, and monitor vegetation recovery.
Today, we explore the value of satellite imagery in wildfire monitoring, including the application of the Normalized Burn Ratio (NBR) in burn area and severity mapping.
The significance of satellite imagery in forest fire monitoring
Satellite imagery data can support wildfire monitoring during the following stages:
- Pre-fire: Satellite images facilitate the detection and monitoring of areas at risk of fire hazards. For example, satellites can detect high temperatures or moisture stress as indicators of forest fires. Satellite imagery can also help mitigate the damage caused by wildfires by identifying people and assets at risk.
- During an active fire: Satellites can inform targeted responses by enabling the determination of the spread direction, detection of fire intensity, and estimation of the fire size and burning area.
- Post-fire: Satellite imagery can help to detect burned vegetation and soil, identify the burn scar, facilitate post-burn severity mapping, and monitor vegetation recovery.
The next sections will describe each of these stages.
Satellite imagery in fire risk assessment
Fire risk is the probability of a fire occurring in an area and its expected impact. It is determined by the analysis of different factors that can cause or affect fire behavior. Fuel is one of these factors, and in forested areas, vegetation constitutes the main fuel.
The vegetation type, extent, moisture content, and health play key roles in wildfire ignition and spread.
How do satellite images enable wildfire risk assessment based on existing vegetation? Let's find out.
Vegetation type and extent: Fire behavior varies with vegetation type. To this end, multispectral and hyperspectral satellite imagery enables the mapping of species composition. Furthermore, satellite imagery facilitates the determination of the proportion of an area covered by a certain vegetation type (fractional cover) enabling further risk assessment.
Vegetation stage and health: Unhealthy vegetation may pose a higher fire risk because it contains a larger proportion of dead and dry leaves or branches than healthy vegetation. Vegetation indices derived from satellite images are useful for the detection of plant health. The deviation of the derived values from the long-term averages can indicate anomalies and thus the potential for fire risk. Examples of relevant vegetation indices include:
- Normalized Difference Vegetation Index (NDVI): measures vegetation greenness as an indicator of vegetation health or stress.
- Enhanced Vegetation Index (EVI): similar to NDVI, measures vegetation greenness but is more suitable for dense forests/vegetation.
- Soil Adjusted Vegetation Index (SAVI): Measures vegetation health in areas with sparse vegetation cover. It minimizes the effect of soil brightness, which tends to impact the NDVI results.
In addition to health detection, vegetation indices are useful for understanding plant phenology or seasonal variations in vegetation—e.g., leaf off and leaf on—for the assessment of potential fuel loads over time.
Vegetation moisture content: Moisture content is an important factor when considering fire ignition. Generally, dry vegetation tends to ignite more easily than moist vegetation does. Moisture indices derived from satellite imagery are useful for assessing vegetation dryness and thus the risk of acting as fuel. Satellite imagery-derived moisture indices include the following:
- Normalized Difference Moisture Index (NDMI): Measures vegetation moisture content as an indicator of water stress because dry vegetation is more susceptible to fire.
- Evaporative Stress Index (ESI): Measures variations in evapotranspiration. It provides an early warning for drought conditions, where vegetation is water-stressed and can thus act as fuel for fire.
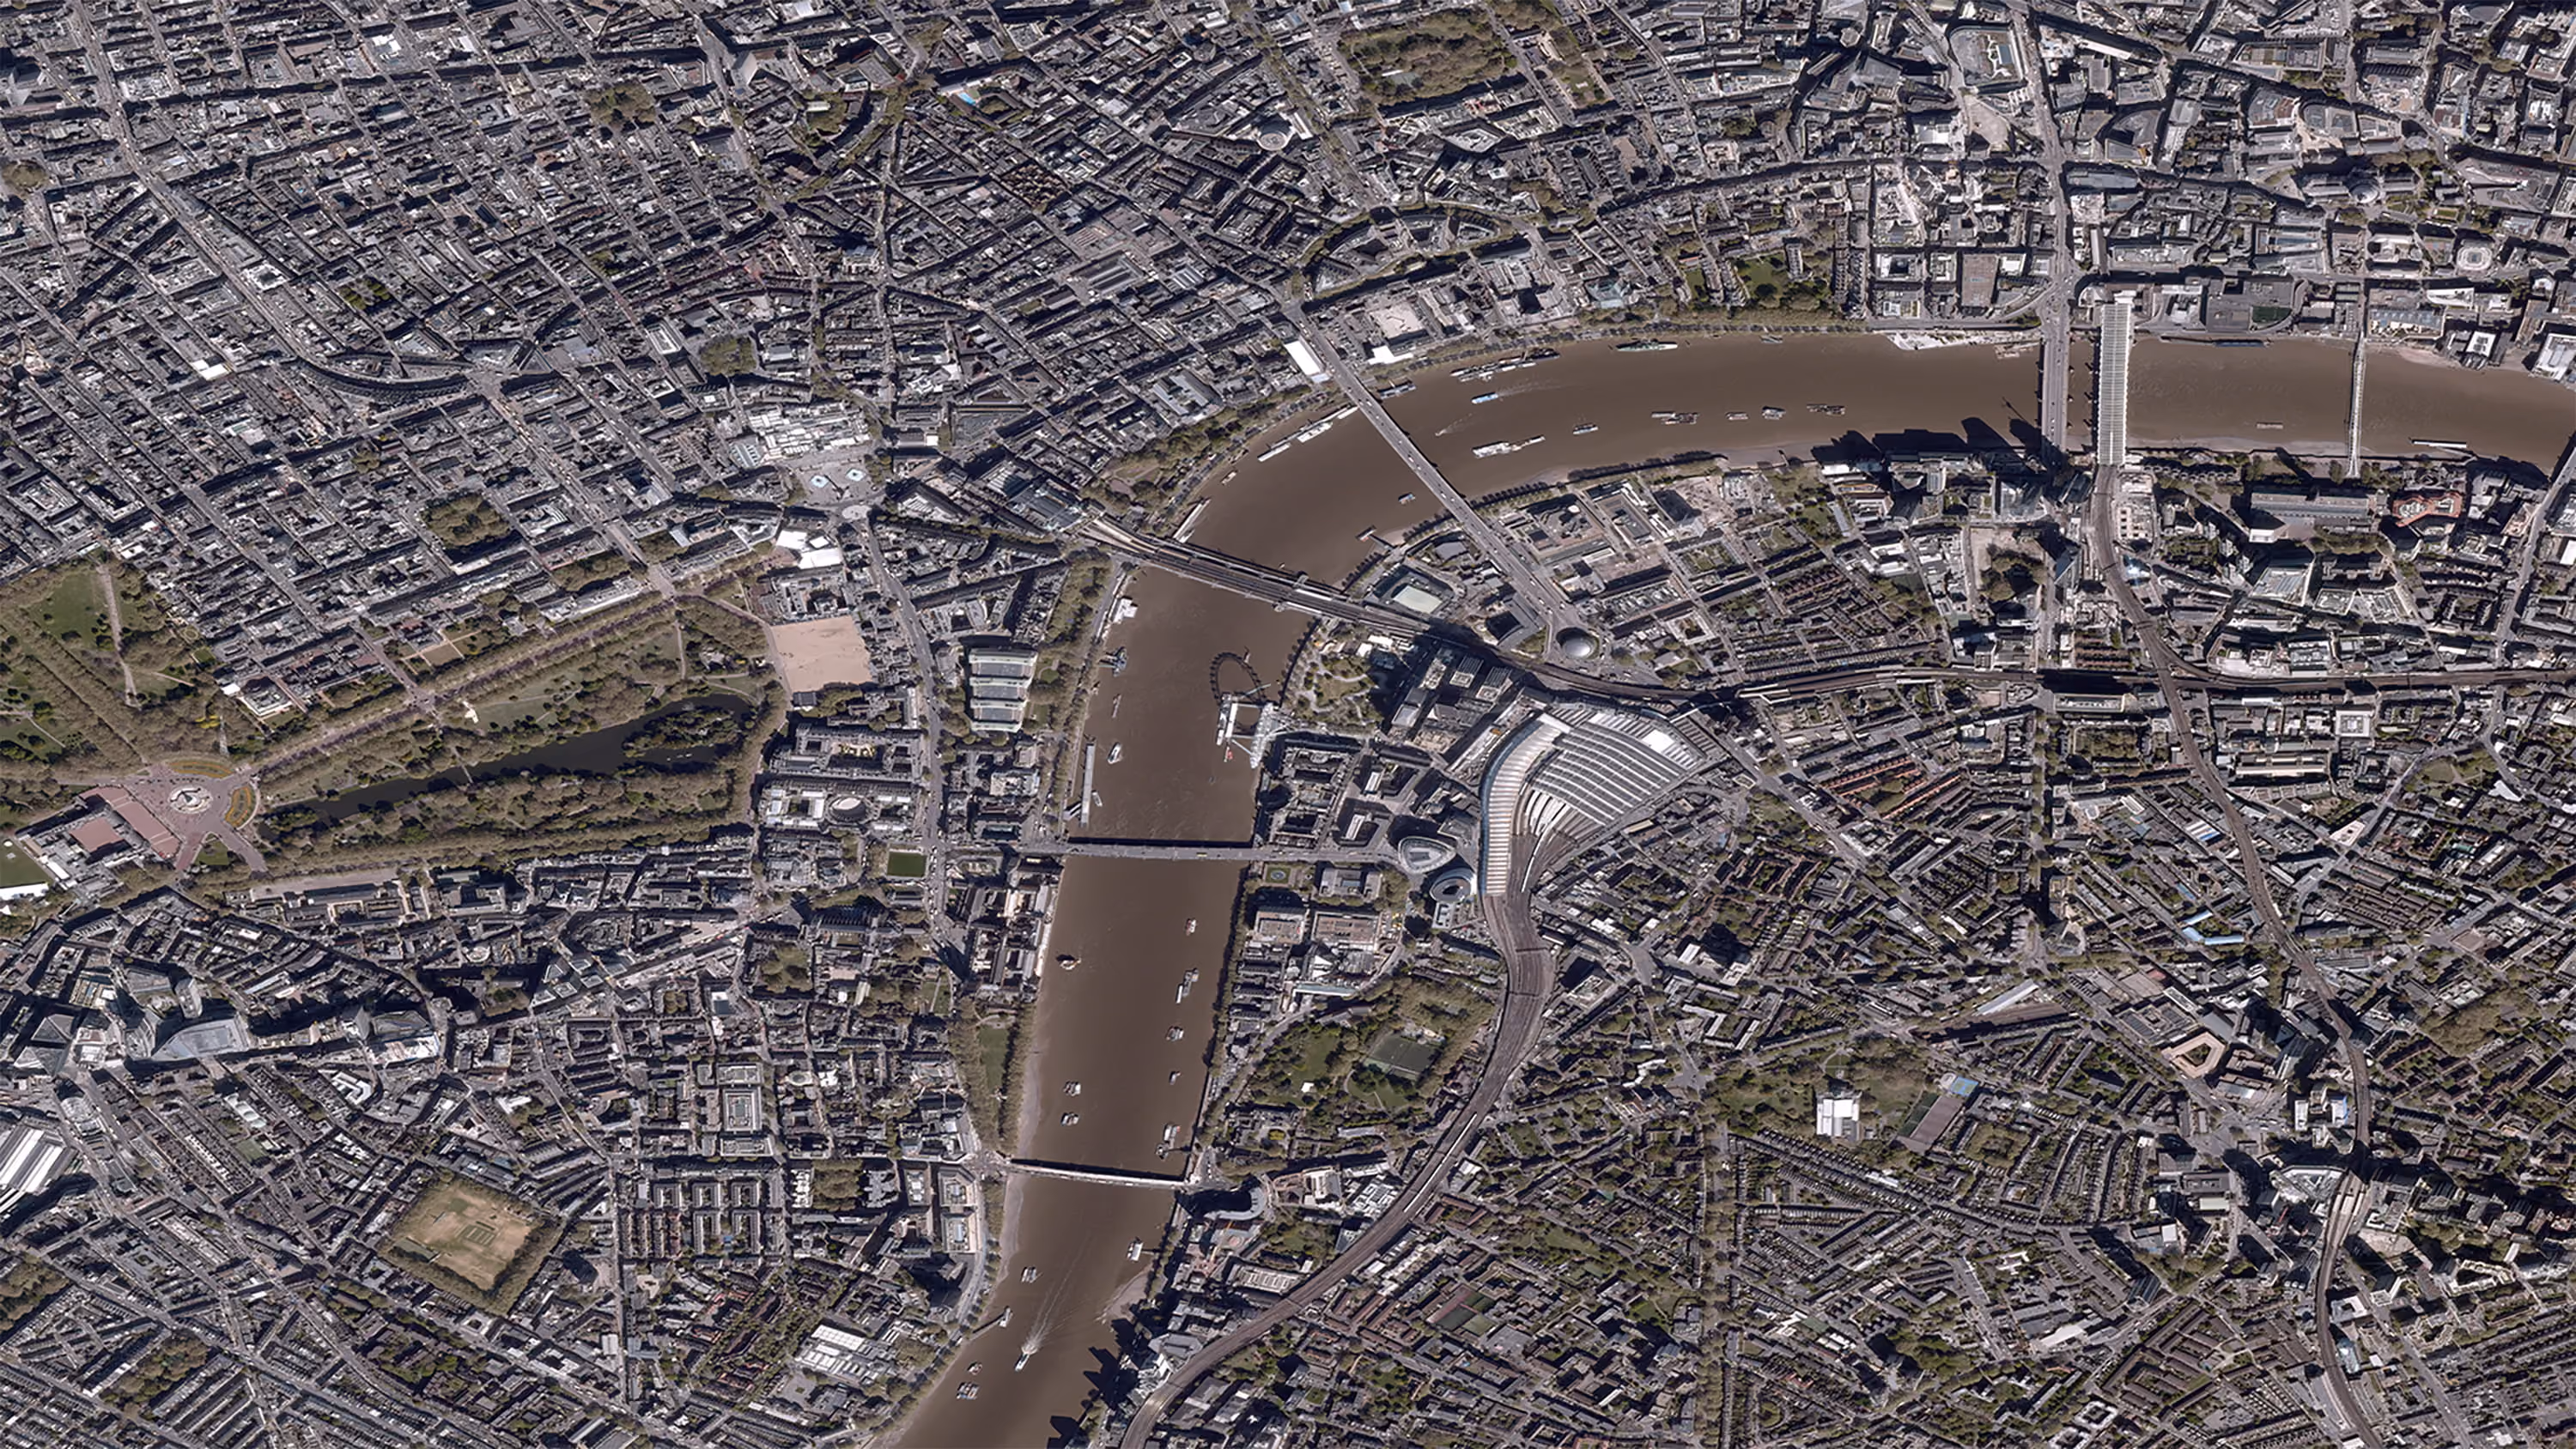
Considering that wildfires can arise from the contact between power lines and vegetation, risk assessment may also entail evaluating vegetation health and clearances along power lines. High-resolution satellite imagery such as Pléiades Neo can complement light detection and ranging (LiDAR) data to identify vulnerable areas to mitigate wildfire risk.
This case study examines the application of satellite imagery to vegetation management.
Other satellite data useful for pre-fire risk assessment
Other satellite data that can provide indicators of potential fire risk areas are:
- Topographic data: Elevation, slope, aspect, and other topographic characteristics may affect the severity and spread of fires. Satellite-derived elevation models enable large-scale fire risk assessment.
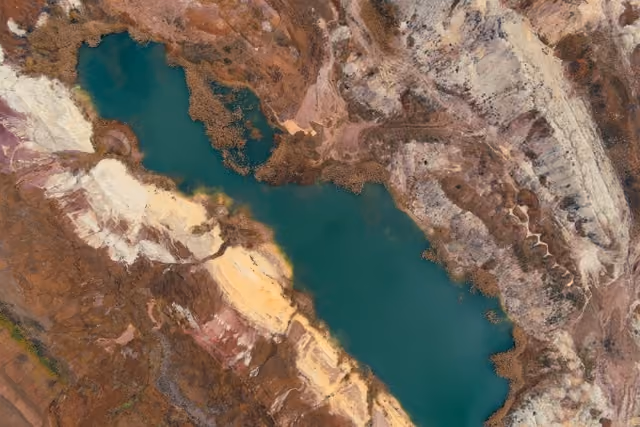
- Soil moisture: Soil moisture conditions provide early warning of potential risk areas. For example, in dry regions, higher than normal soil moisture may indicate more vegetation growth, and hence, high loads of dry fuel in the dry seasons. Conversely, lower than normal soil moisture in humid regions can be an indicator of drying vegetation, and thus, a higher fire risk. Synthetic aperture radar (SAR) imagery is sensitive to soil moisture conditions and is therefore applicable to soil moisture measurements for fire risk assessment and monitoring.
Satellite imagery in active fire tracking
Heat is released whenever vegetation and organic soils burn, The emitted heat leads to higher temperatures in the burning area than the surrounding surface. The infrared frequencies of the electromagnetic spectrum are sensitive to the temperature difference. Therefore, they are used by satellite sensors to detect thermal anomalies as indicators of potential wildfires. In this manner, satellites can detect the approximate location of wildfires and their movements.
NASA's Visible Infrared Imaging Radiometer Suite (VIIRS) and Moderate Resolution Imaging Spectroradiometer (MODIS) are commonly used sensors for near-real-time wildfire detection. They provide data on potential active wildfires within approximately 3 hours of observation. However, their coarse spatial resolution does not enable the reliable detection of small fires. Other limitations include:
- Active fire omission due to obstruction by cloud cover, thick smoke, or canopy cover
- Omission of short-lived fires that start and end between observations
To counter the above limitations, medium-resolution satellite imagery, such as Sentinel-2 and Landsat, is used for local-scale fire detection and mapping. Their higher resolution enables the detection of smaller fires compared with coarse-resolution MODIS and VIIRS sensors. For example, small fires covering approximately 4m2 and 1m2 have a more than 50% chance of detection using Landsat daytime and nighttime observations respectively.
Additionally, geostationary satellites, which remain at a fixed point above the Earth, provide high temporal resolution data on active fires in specific regions. They enable the detection of short-lived fire events and facilitate tracking of forest fires.
Satellite imagery in post-fire burn assessment
Determining the extent of the burned area, as well as the severity levels, is an important first step toward estimating fire effects and planning restoration measures. Satellite imagery facilitates burn area and severity mapping, and is also useful for assessing vegetation regeneration and conditions at different intervals after the fire. In the following sections, we will explore these issues in greater detail.
We begin by defining the key terms:
- Fire intensity: Energy or heat released per unit time or area during various phases of the fire.
- Fire severity: The degree to which an area has been altered or disrupted by a fire. This is related to the loss of above-ground or below-ground organic matter, including soil and vegetation, caused by fire.
- Burn severity: Used interchangeably with fire severity to refer to the fire-induced loss of above-ground or below-ground organic matter. This paper recommends that the term be restricted to the field assessment of burn severity as opposed to that evaluated using remote sensing data. Nevertheless, the term is typically used to refer to assessments performed using remote sensing data. Burn severity can be divided into soil and vegetation burn severity.
Both fire severity and burn severity are positively correlated with fire intensity.
Burn area and severity are computed using the normalized burn ratio and differenced normalized burn ratio respectively.
Normalized Burn Ratio (NBR): A key tool
The normalized burn ratio (NBR), also known as the normalized burn index, is used to identify burned areas using satellite imagery. The NBR is computed by combining information in the near-infrared (NIR) and shortwave infrared (SWIR) bands as follows:
NBR = NIR - SWIRNIR + SWIR
Following a wildfire, the spectral reflectance of the burned surface changes. The NBR exploits this variation to identify the burned area. Here's how it works:
Healthy vegetation has high reflectance in the green and NIR regions of the electromagnetic spectrum but exhibits low reflectance in the red and SWIR regions. Burnt vegetation, on the other hand, has a higher reflectance in the SWIR region than in the NIR region. This difference between NIR and SWIR reflectance in burnt and healthy vegetation is used to identify the burnt areas.
NBR is a unitless value ranging between 1 and -1. NBR values are:
- strongly positive in areas with dense healthy vegetation,
- near zero in areas with sparse or dry vegetation, and
- negative when there is little or no green vegetation cover and soil exposure is high, for example after a recent fire.
Existing burn area products include those computed from Moderate Resolution Imaging Spectroradiometer (MODIS) and Visible Infrared Imaging Radiometer Suite (VIIRS) instruments. They provide global coverage at 500 m spatial resolution. High-resolution satellite images can complement these for fine-scale burn area mapping and impact assessment, particularly for small fires.
After identifying the burned areas, the next step is mapping the burn severity levels in the burn scar.
Burn severity mapping: Differenced normalized burn ratio (dNBR)
We obtain the burn severity by subtracting the post-fire NBR from the pre-fire NBR.
dNBR = Prefire NBR - Postfire NBR
A higher value indicates a greater change in vegetation cover. Therefore, in the absence of other factors (such as phenological changes in vegetation or differences in illumination between image dates),
- low dNBR values indicate low burn severity,
- zero values represent areas unaffected by the fire, and
- high dNBR values represent higher burn severity.
The resulting map may be classified into different burn severity levels depending on the dNBR pixel values.
Note: The dNBR values used as thresholds during classification should correspond to the burn severity patterns in the affected area. Thus, ground visits are key to calibrating ground burn severity and remotely sensed dNBR severity estimates.
Factors to consider in NBR and dNBR computation and interpretation
Vegetation phenology: Pre- and post-fire satellite images should be taken in the same season to minimize differences caused by seasonal vegetation variations. Generally, images should match phenologically, for example, when vegetation is green.
Clouds, thick smoke, cloud shadows, and other artifacts can affect the obtained values. For example, clouds can obstruct the surface, thereby affecting burn area and severity assessment. As such, if possible, the selected images should have no artifacts.
Land cover: Bare soil present before a fire may be captured as burned landscape in the NBR. Furthermore, land use land cover changes not caused by fire, such as deforestation, show up as as fire-induced changes in dNBR computations and may thus be interpreted as high or low severity. Land cover maps created before a fire can help to exclude such areas from burned area estimates.
Complementary remote sensing techniques for burn area and severity mapping
In addition to NBR and dNBR, other techniques are used for burn area and severity mapping. We briefly touch on two examples below.
Relativized differenced normalized burn ratio (RdNBR)
RdNBR is a variant of dNBR, which is sometimes used to measure burn severity. It was developed by Miller and Thode (2007) for severity mapping and considers the effects of fires on vegetation.
RdNBR =dNBR(PreFireNBR)
The argument for RdNBR is that sparsely vegetated areas have low pre-fire NBR values, and thus low dNBR values, regardless of the degree of fire-induced damage to vegetation. Therefore, dNBR does not quantify such areas as severity burnt, even if all vegetation is burnt. In other words, the dNBR shows low sensitivity in areas with low pre-fire vegetation cover.
In summary, while dNBR measures burn severity based on the absolute change between the pre- and post-fire images, RdNBR computes the relative change caused by fire.
However, the use of dNBR vs. RdNBR for fire severity mapping is an ongoing debate. While some studies found better correspondence of dNBR values to field-based measurements, others concluded that RdNBR performs better.
SAR imagery for burn area and severity mapping
Although not as commonly used as optical data, SAR imagery plays a critical role in wildfire monitoring. Thick smoke and clouds can obscure wildfires and burned areas in optical imagery. SAR is unaffected by clouds, smoke, or the time of day. It provides an opportunity for round-the-clock near-real-time wildfire monitoring, mitigating the shortcomings of optical imagery.
Furthermore, SAR backscatter is sensitive to surface characteristics. Therefore, burnt area detection is possible based on changes that occur after a wildfire, including the removal of vegetation, exposure of the rough underlying ground, and increased soil moisture.
Post-fire recovery: The role of satellite imagery in tracking vegetation regrowth
Wildfires can lead to long-term changes in vegetation structure, composition, and ecosystem functions. Monitoring post-fire vegetation recovery is crucial to support ecosystem restoration and post-fire management.
Satellite imagery is suitable for monitoring vegetation recovery in burnt areas due to:
- Sensitivity to changes in reflectance caused by an increase in vegetation cover and a decrease in bare soils
- Regular large area coverage enabling large-scale assessment of temporal patterns of vegetation recovery
Optical satellite images are commonly used because they capture spectral information, which helps assess post-fire vegetation conditions using spectral indices. Examples of such indices include the NDVI and EVI.
In addition to burn area and severity mapping, NBR can be applied to examine post-fire vegetation recovery. An increase in the NBR values over time indicates vegetation recovery, with higher values indicating denser vegetation.
SAR imagery can complement optical imagery. Depending on the wavelength, they can retrieve information below the canopy, allowing monitoring of the vertical structure of post-fire vegetation.
The role of satellite data in assessing wildfire impacts on air quality
Wildfires release large amounts of smoke into the atmosphere. The smoke can be transported and dispersed to far-off regions, resulting in poor air quality in regions away from fires. For example, smoke from the 2023 wildfires in Canada was transported across the Atlantic to parts of Europe. In this regard, satellite imagery aids in tracking and modeling smoke movement.
In many regions, wildfire emissions are a significant source of air pollution with adverse effects on air quality and, consequently, human health. For example, exposure to fine inhalable particles smaller than 2.5 micrometers in diameter (PM2.5) can lead to respiratory disease. In conjunction with ground measurements, satellite observations are useful for monitoring and estimating air pollution caused by wildfires.
Putting it all together
In a changing climate, the occurrence, frequency, and length of wildfires are likely to increase. Satellite images play a vital role in wildfire monitoring and post-fire assessment.
Pre-fire, they facilitate fire risk analysis based on vegetation conditions and moisture content. During active fires, they are useful in detecting and tracking fire and smoke progression. And after the fire, they aid in mapping the burnt area extent, determining burn severity levels, and monitoring vegetation recovery in the affected areas.
Got any burning questions? We'd be happy to help. Reach out to us and we'll get back to you as soon as possible.

Subscribe to our newsletter
Stay up to date and learn about our fast-growing new features