What is SAR data? Synthetic aperture radar, explained
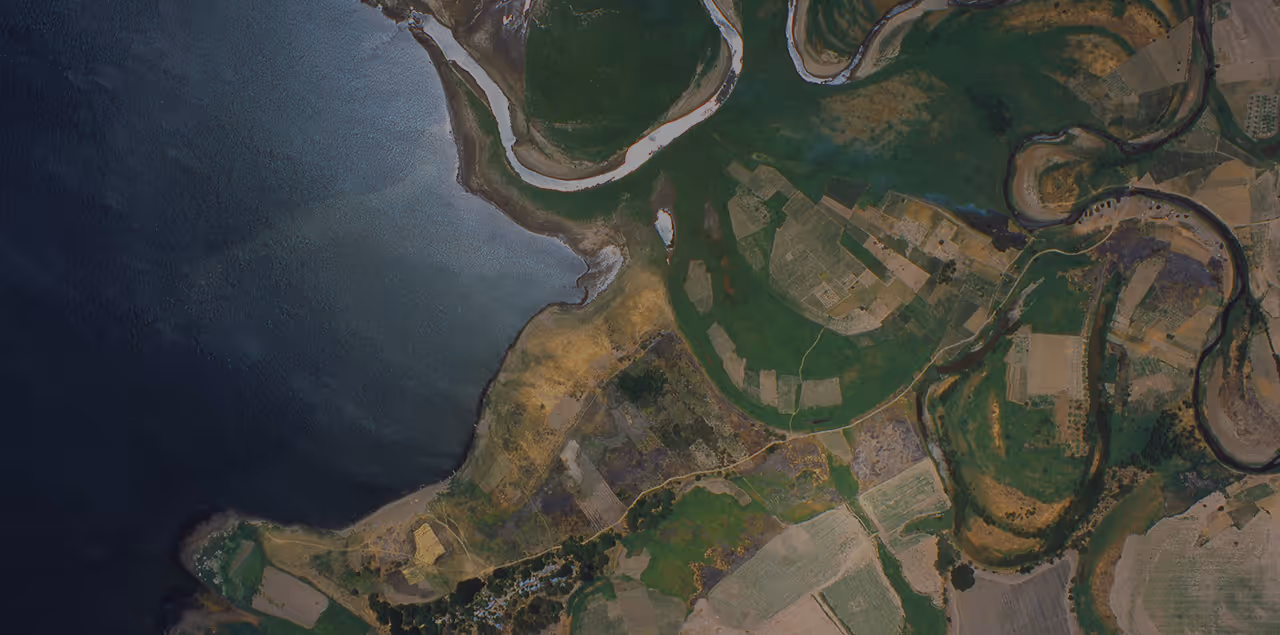
Ask the average person about satellite imagery, and they’ll probably think about Google Earth or something similar. Optical images make the most sense to the human eye, though they may need orthorectification, (perspective and distortion correction). SAR images, on the other hand, are grayscale and need significant processing before they’re ready to use.
But post-processing, they’re a goldmine of information. You can use them to map all kinds of terrain and features, detect changes, and capture images in conditions where optical satellites can’t see a thing.
What is SAR?
Synthetic aperture radar (SAR) is a method of remote sensing that places a sensor onto a moving platform. This includes aerial platforms (like drones or aircraft) and spacecraft such as satellites.
SAR is an active sensing method, which means the sensor emits its own source of radiation and collects the returned information to form an image. This is different from optical sensors, which capture existing radiation in their images. In SAR's case, it uses microwaves, which run from frequencies of 1 gigahertz to 300 gigahertz on the electromagnetic spectrum.
Generally speaking, when it comes to radar, the larger the antenna, the larger its aperture (the portion of the antenna that emits and/or collects radiation). Given current technology, bigger is better. But nobody wants to mount a satellite with a three kilometer long antenna.
SAR gets around this by using the space that it passes through above its target area as its antenna, thus creating an artificial antenna that can span multiple kilometers. Hence the name "synthetic aperture."
Here's an example of why SAR rules: Airbus' TerraSAR-X satellite uses a 5-meter-long antenna to capture very high resolution imagery below 1 m. Without the SAR technique, TerraSAR-X would need an antenna over 15 km long. Imagine trying to get funding for that.
What do SAR images look like?
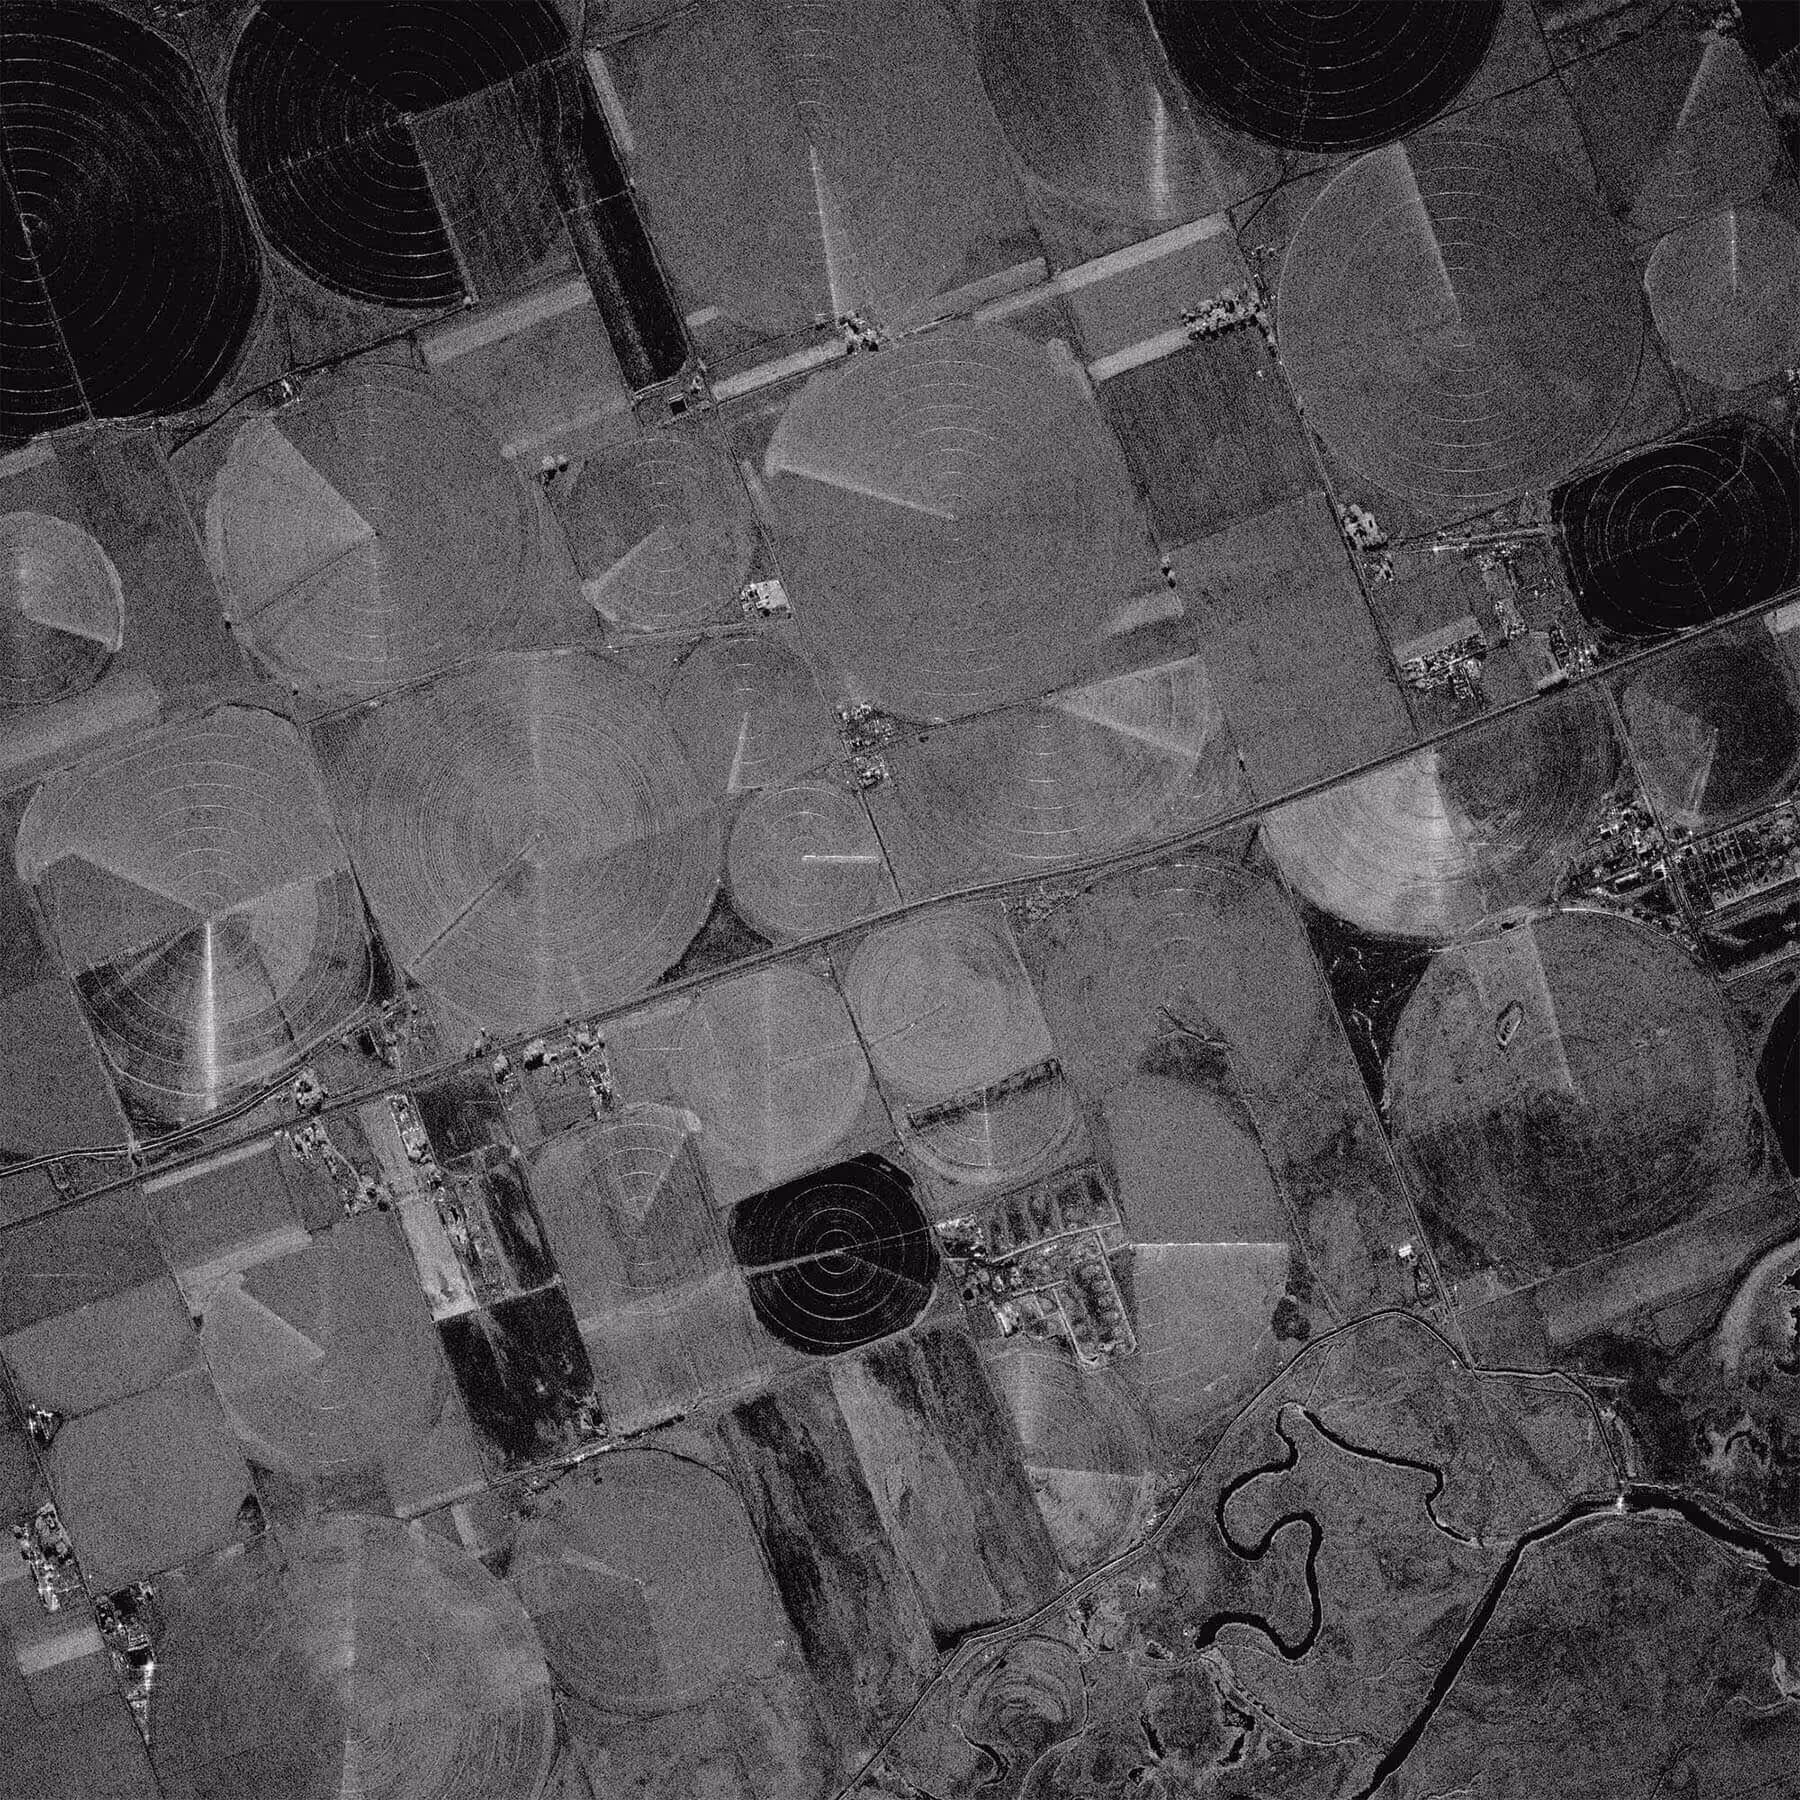
SAR images, unprocessed, kind of look like TV static. This is because SAR collects the radiation backscatter of every object in its area of interest (AOI). So the images come out in greyscale, with objects with high reflectance appearing lighter, and objects with lower reflectance appearing darker. Water, for example, absorbs the majority of microwaves directed at it, so it usually appears black in SAR images.
After processing, the human eye can better understand a SAR image. But more commonly, machine learning algorithms will then be applied to extract insights, rather than an individual or team doing so manually.
Are there different types of SAR?
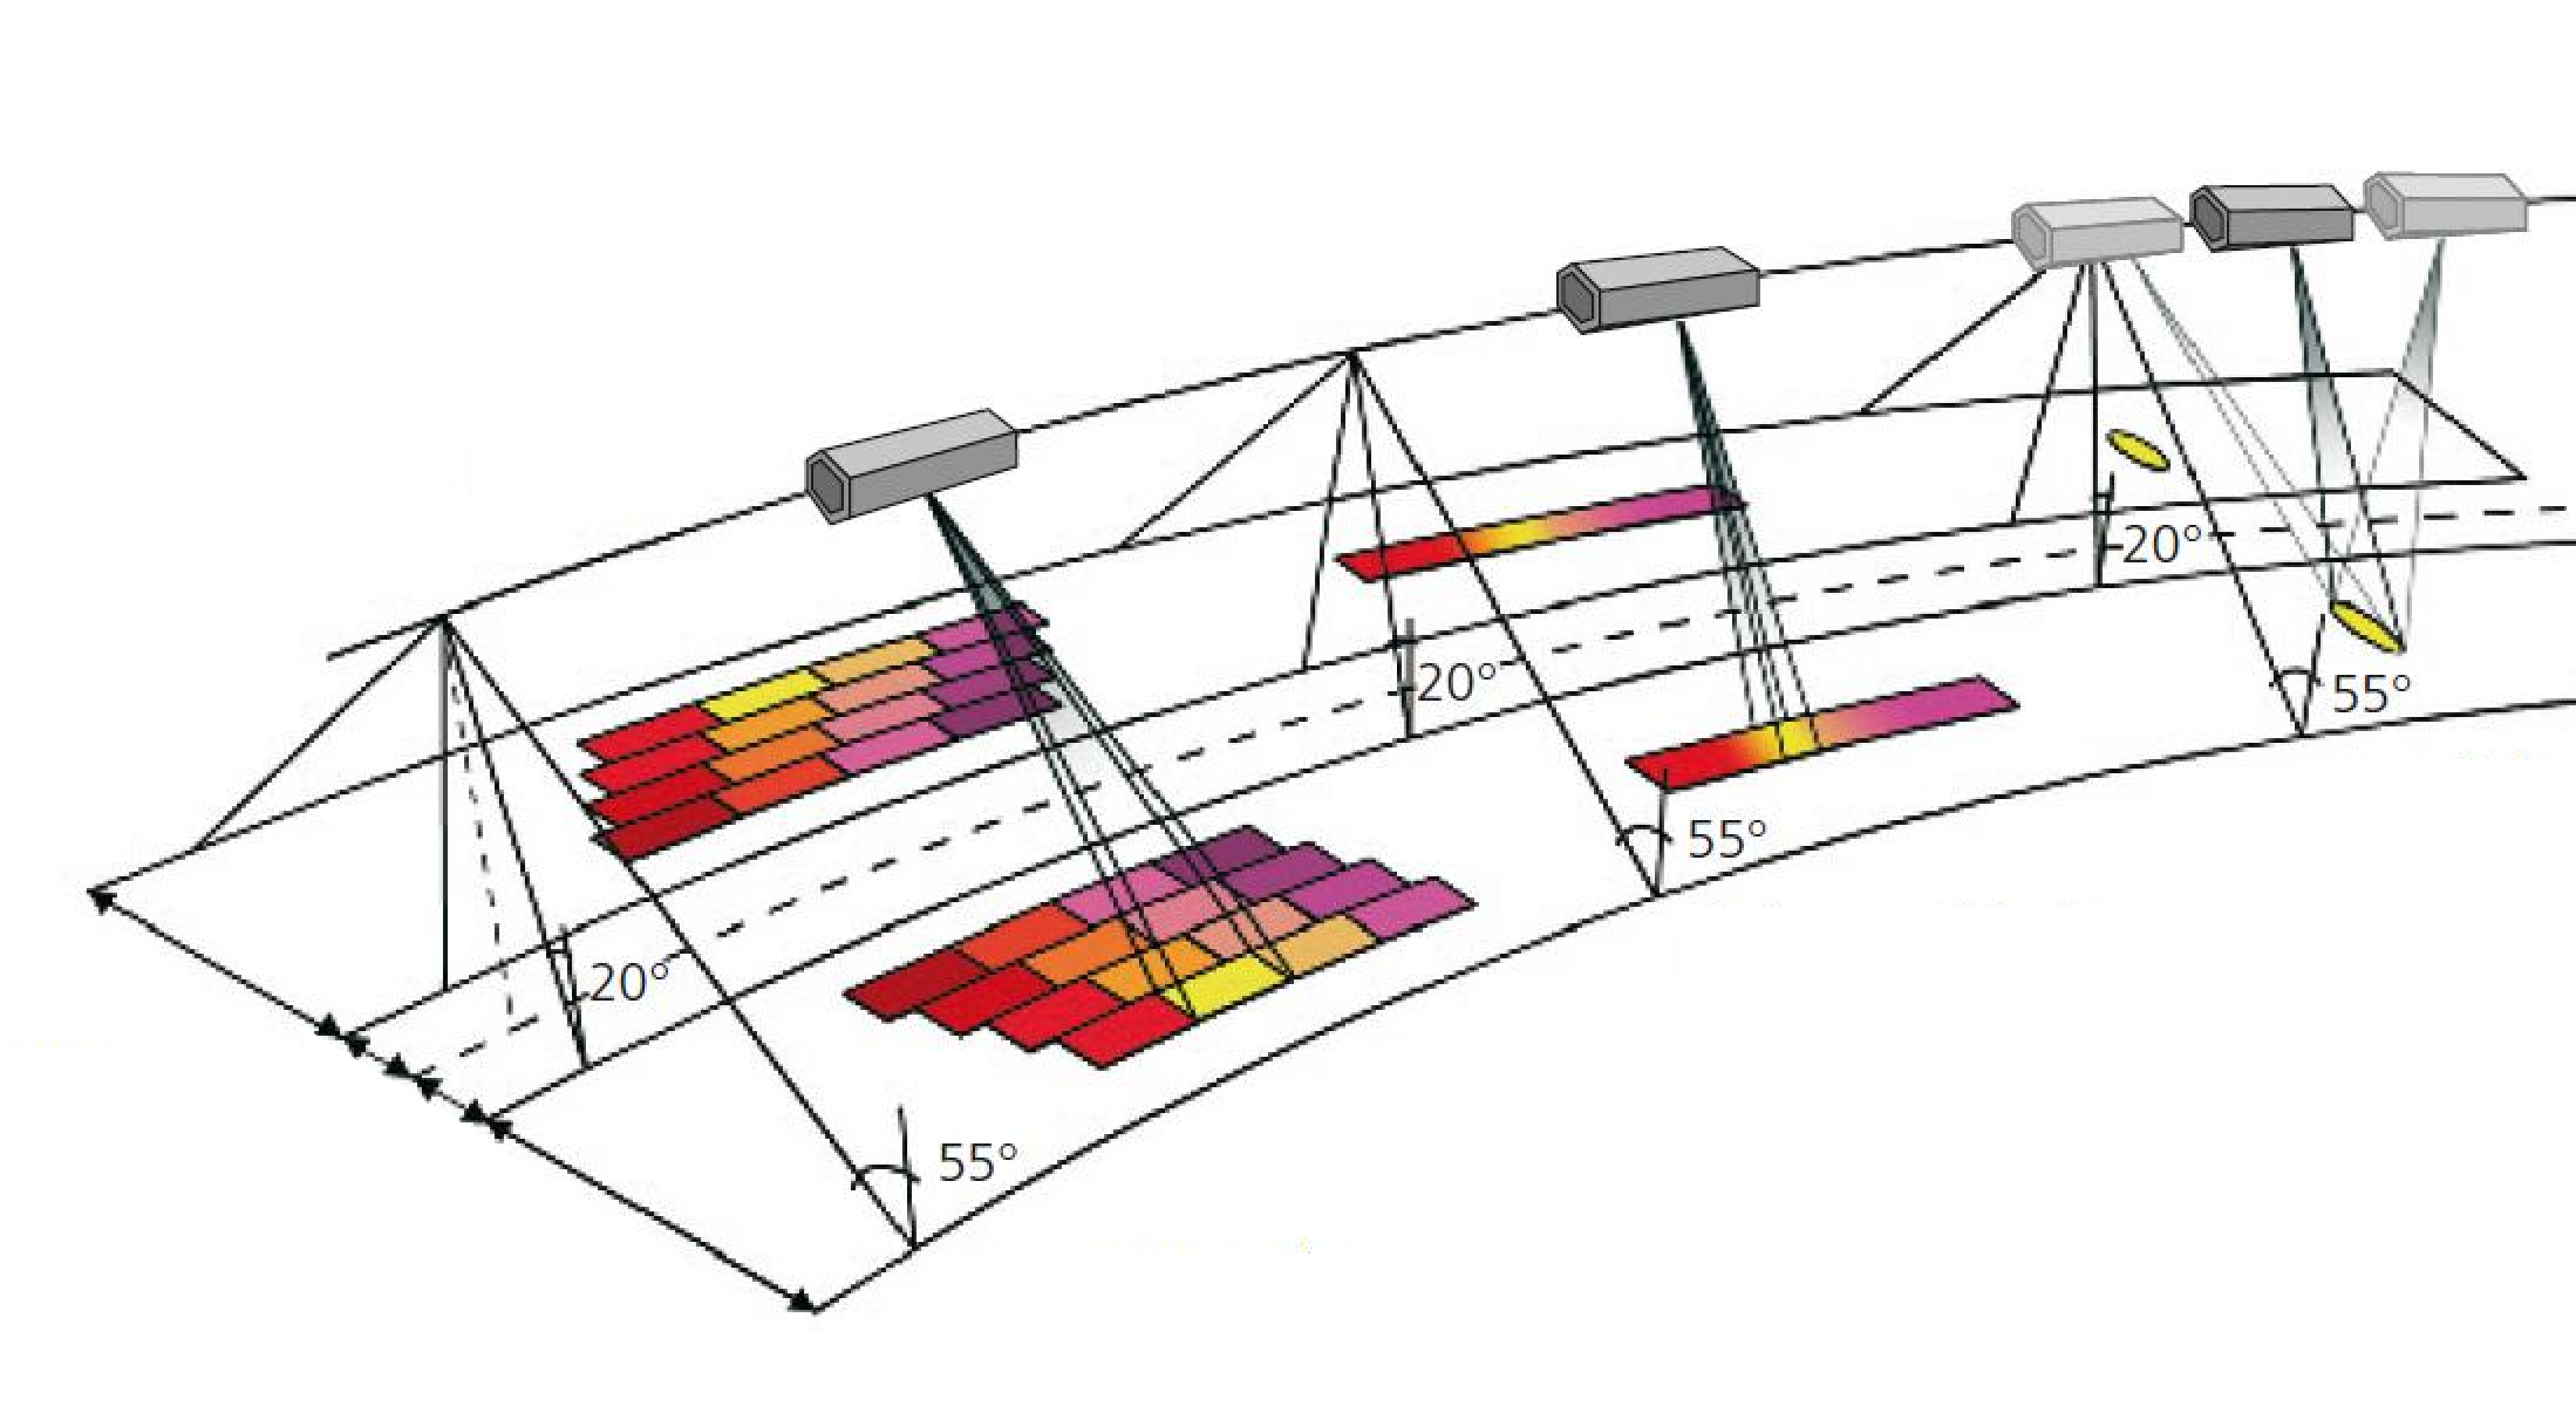
SAR has a number of imaging modes, meaning how SAR is applied to capture an AOI. The image below shows the three main modes, with more in-depth explanations further down.
If you see different terms online, remember that some providers may use different names, or variations on them, for the below modes. We've tried to include synonyms where possible.
Scan
In scan mode, the antenna sweeps back and forth repeatedly over the AOI as it passes. The antenna can also adjust its angle, allowing for a wider scene than in spot or strip mode. The collected data is then processed into one long scene.
This type of imaging mode allows for the largest possible scene, but at a lower resolution than the other modes.
Strip (also called stripmap)
In strip mode, the antenna stays in a fixed position as it passes over the AOI, for a single continuous strip.
This mode offers a higher spatial resolution than spot mode, but it captures a smaller scene.
Spot (also called spotlight)
In spot mode, the antenna stays fixed on the same patch of ground, adjusting as it moves to capture as much as it possibly can over the course of its platform's flight path. Like how a spotlight follows a comedian around a stage, but if the comedian were stationary and the spotlight itself were moving along a set track.
This mode offers the highest possible spatial resolution, but the smallest scene size. So it's best used when you need a finely detailed image of a specific point.
A common variation on spot, called site or sliding spot, involves adjusting the angle as the sensor passes overhead to capture more of the spotlighted area. This will result in a slightly larger swath, but at a lower resolution.
Where did SAR come from?
SAR was invented in Arizona 1952, by mathematician Carl A. Wiley. On a side note: Wiley also originated the idea of solar sails in a sci-fi short story. These days, solar sails are a real method of spacecraft propulsion. Absolute visionary.
At the time, Wiley was working on guidance systems for ballistic missiles. He had the realization that radar reflections from stationary objects passed by a moving radar beam each had a tiny but significant Doppler, or speed, shift relative to the antenna. By analyzing the frequency of the returned signals, Wiley found that a small portable antenna could create radar images of such detail that they would have required a football field-length stationary antenna.
Wiley's first patent came a few years later. He called it Simultaneous Buildup Doppler. Today, we just call it SAR, which rolls off the tongue by comparison (You pronounce this as one word, "sar," rather than saying the letters individually). SAR stayed mostly within the military for several more decades, until the 1970s, when it started gaining traction for civilian mapping purposes. And all the while, it was constantly improving.
What can you do with SAR?
And now for the real important stuff: what are SAR's major use cases?
One of SAR's biggest advantages is that, unlike optical imagery, it can penetrate through clouds and smoke. The use cases we discuss below are some of the most relevant and widely used today. It's not an exhaustive list, as people are thinking up new uses for SAR all the time.
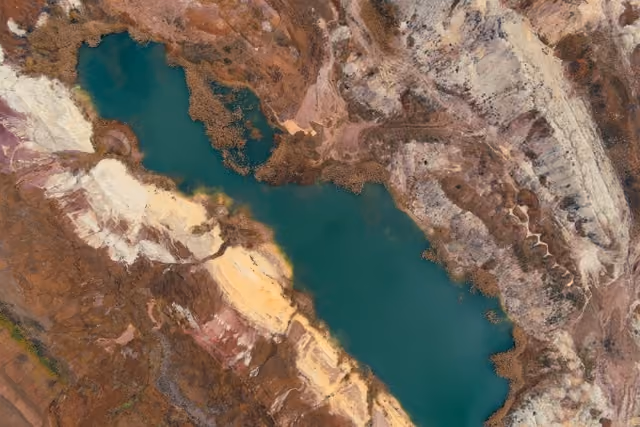
Subsidence monitoring and volumetric change detection
SAR Interferometry (InSAR for short) is a technique that uses multiple SAR images of the same area, taken at the same time, to create three-dimensional maps of the ground's surface. Due to SAR's sensitivity, it can detect changes of even a few millimetres, which makes it invaluable for monitoring subsidence: the gradual sinking of the ground.
Subsidence can be caused by a huge variety of factors, including mining or oil and gas extraction. In these cases, subsidence measurements can be used to plan for necessary infrastructure or equipment changes, and to ensure worker safety.
InSAR can also be used to detect volumetric change in objects over time, such as glaciers, to help us measure the impact and effects of global warming.
For more on interferometry techniques, check out our dedicated article.
Deforestation monitoring
Changes in forest canopies are easily tracked through SAR data, as fewer trees equals less backscatter. Many important conservation groups, including the Amazon Conservation Association, use satellite imagery to track deforestation in the Amazon. Solutions have evolved as illegal loggers have gotten wise to them.
At first, groups used low resolution optical imagery to monitor deforestation, but this could only pick up bigger clearings, so illegal loggers shrank their clearing sizes. As resolutions became higher and revisit rates more frequent, illegal loggers starting increasing their activity during the rainy season, in the hopes that their activities would stay hidden. They didn't count on SAR imagery.
Conservation groups are now integrating SAR data into their solutions, aiming to catch deforestation at any time, in any weather.
Oil spill detection and monitoring
Since oil has a different backscatter signal compared to water, SAR can be used to detect and monitor oil spills over large areas. Thicker layers of oil reflect less than thin layers, so SAR can pinpoint origins and track the outer edges of spills.
One thing that's important to note: if a spill is too thin, as in a relatively minor leak from a small vessel, then SAR may not detect it. But scientists and researchers are building algorithms to help narrow down the uncertainty around oil spill detection through SAR data.
Earthquake damage assessments
When governments and organizations examine the impact of an earthquake, they often need to look at huge swaths of land in urban areas full of debris. Satellite and aerial imagery is an important tool here.
The Puebla earthquake, which affected the greater Mexico City area on September 19th, 2017, caused huge amounts of damage, including the complete collapse of more than 40 buildings. To assist the Mexican government, NASA used data from the Copernicus Programme's Sentinel-1 satellite to compare imagery of the area taken on September 8th with imagery taken just 6.5 hours after the quake struck.
The map they created covered an area of 175 by 170 km. It showed areas of building damage and ground surface deformation detected by radar, to pinpoint areas that needed assistance, evacuation, and reconstruction. In this case, SAR's ability to penetrate the clouds of dust raised by the earthquake was essential. You can read more and find the full map here.
Flooding and sea level rise
We've written about the ways in which geospatial data can help monitor sea level rise before. In short, SAR data can be used to build digital elevation models that help identify areas where coastal infrastructure may be in danger from rising sea levels, allowing us to prepare via protection methods like dikes or sea walls, accommodation methods such as raising infrastructure levels, or relocation.
In 2019, Cyclone Idai struck the Eastern coast of Africa. It was one of the worst tropical storms on record, causing catastrophic damage and multiple humanitarian crises. The European Space Agency used SAR data from Sentinel-1 to map the impact of the flooding in Mozambique to aid relief efforts. Despite the still-raging storm's aftereffects, Sentinel-1 visualized the damage through the rain clouds.
Wildfire tracking
SAR helps enormously with wildfire tracking at all stages. First off, as we covered, but will repeat ad nauseam cause it's so important, SAR can penetrate smoke, so that makes it easy to track in-progress wildfires and their perimeters. SAR can detect these through their changing backscatter signals, as fires cause the ground to heat up and leave burned vegetation and earth in their wake, all of which is measurable through backscatter signals. SAR can also be used to detect the extent of damage from wildfires across thousands of kilometers.
SAR data on UP42
We've got a bunch of the world's top providers of SAR data on UP42. The links below will bring you to each provider's marketplace page, where you'll find more technical details. You can find even more information, along with a chart showing the imaging modes of all our providers, in our documentation.
Capella Space: This U.S.-based partner offers very high resolution SAR of up to 50 cm in spot or strip mode, and boasting an impressive revisit rate of up to 5 times per day. Available for tasking or as a range of archive products.
Umbra: Founded in California, Umbra offers very high resolution SAR of up to 25 cm in spot mode, with an incredible revisit rate of up to every 96 minutes. Available for tasking.
TerraSAR-X: From Airbus, TerraSAR-X offers very high resolution SAR of up to 25 cm in spot, strip, or scan modes, available for tasking.
ICEYE: This partner, based in Finland, offers high resolution SAR of up to 1 m in spot, strip, or scan modes, available for tasking.
KOMPSAT-5: SIIS, a Korean partner, offers high resolution SAR of up to 85 cm in spot, strip, or scan mode, available for tasking.
See a use case that you're interested in, or have more questions about SAR? Reach out to us–our team would be happy to help.

Subscribe to our newsletter
Stay up to date and learn about our fast-growing new features