How DSMs and DTMs are used to assess SLR risks for critical infrastructure
The global mean sea level is rising.
While the global mean sea level rose by 1.7 mm/year in the 20th century, satellite records show that there was a marked acceleration from 1993, with the sea level rising at 3 mm/year.
In its 2019 report, the IPCC estimates that by 2100, the global mean sea level may rise by 0.61-1.10 meters (relative to 1986-2005) if greenhouse gas emissions continue to increase.
Key factors driving sea-level rise include melting glaciers and ice sheets and thermal expansion of ocean water because of rising temperatures.
So, why is sea-level rise a problem?
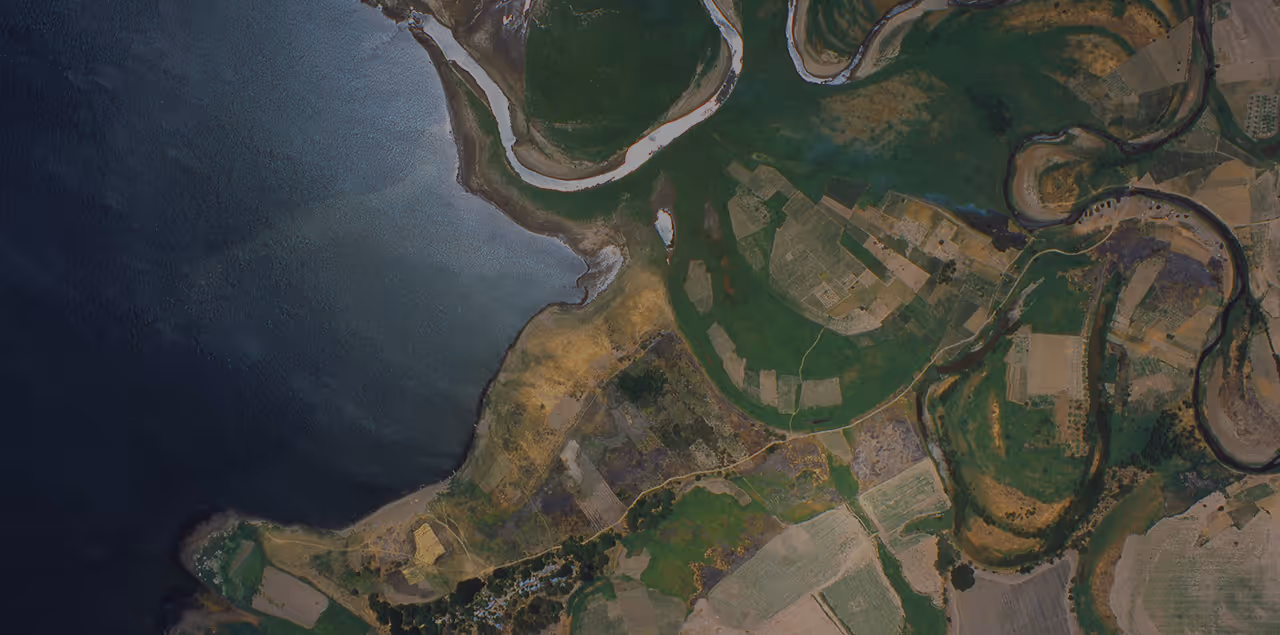
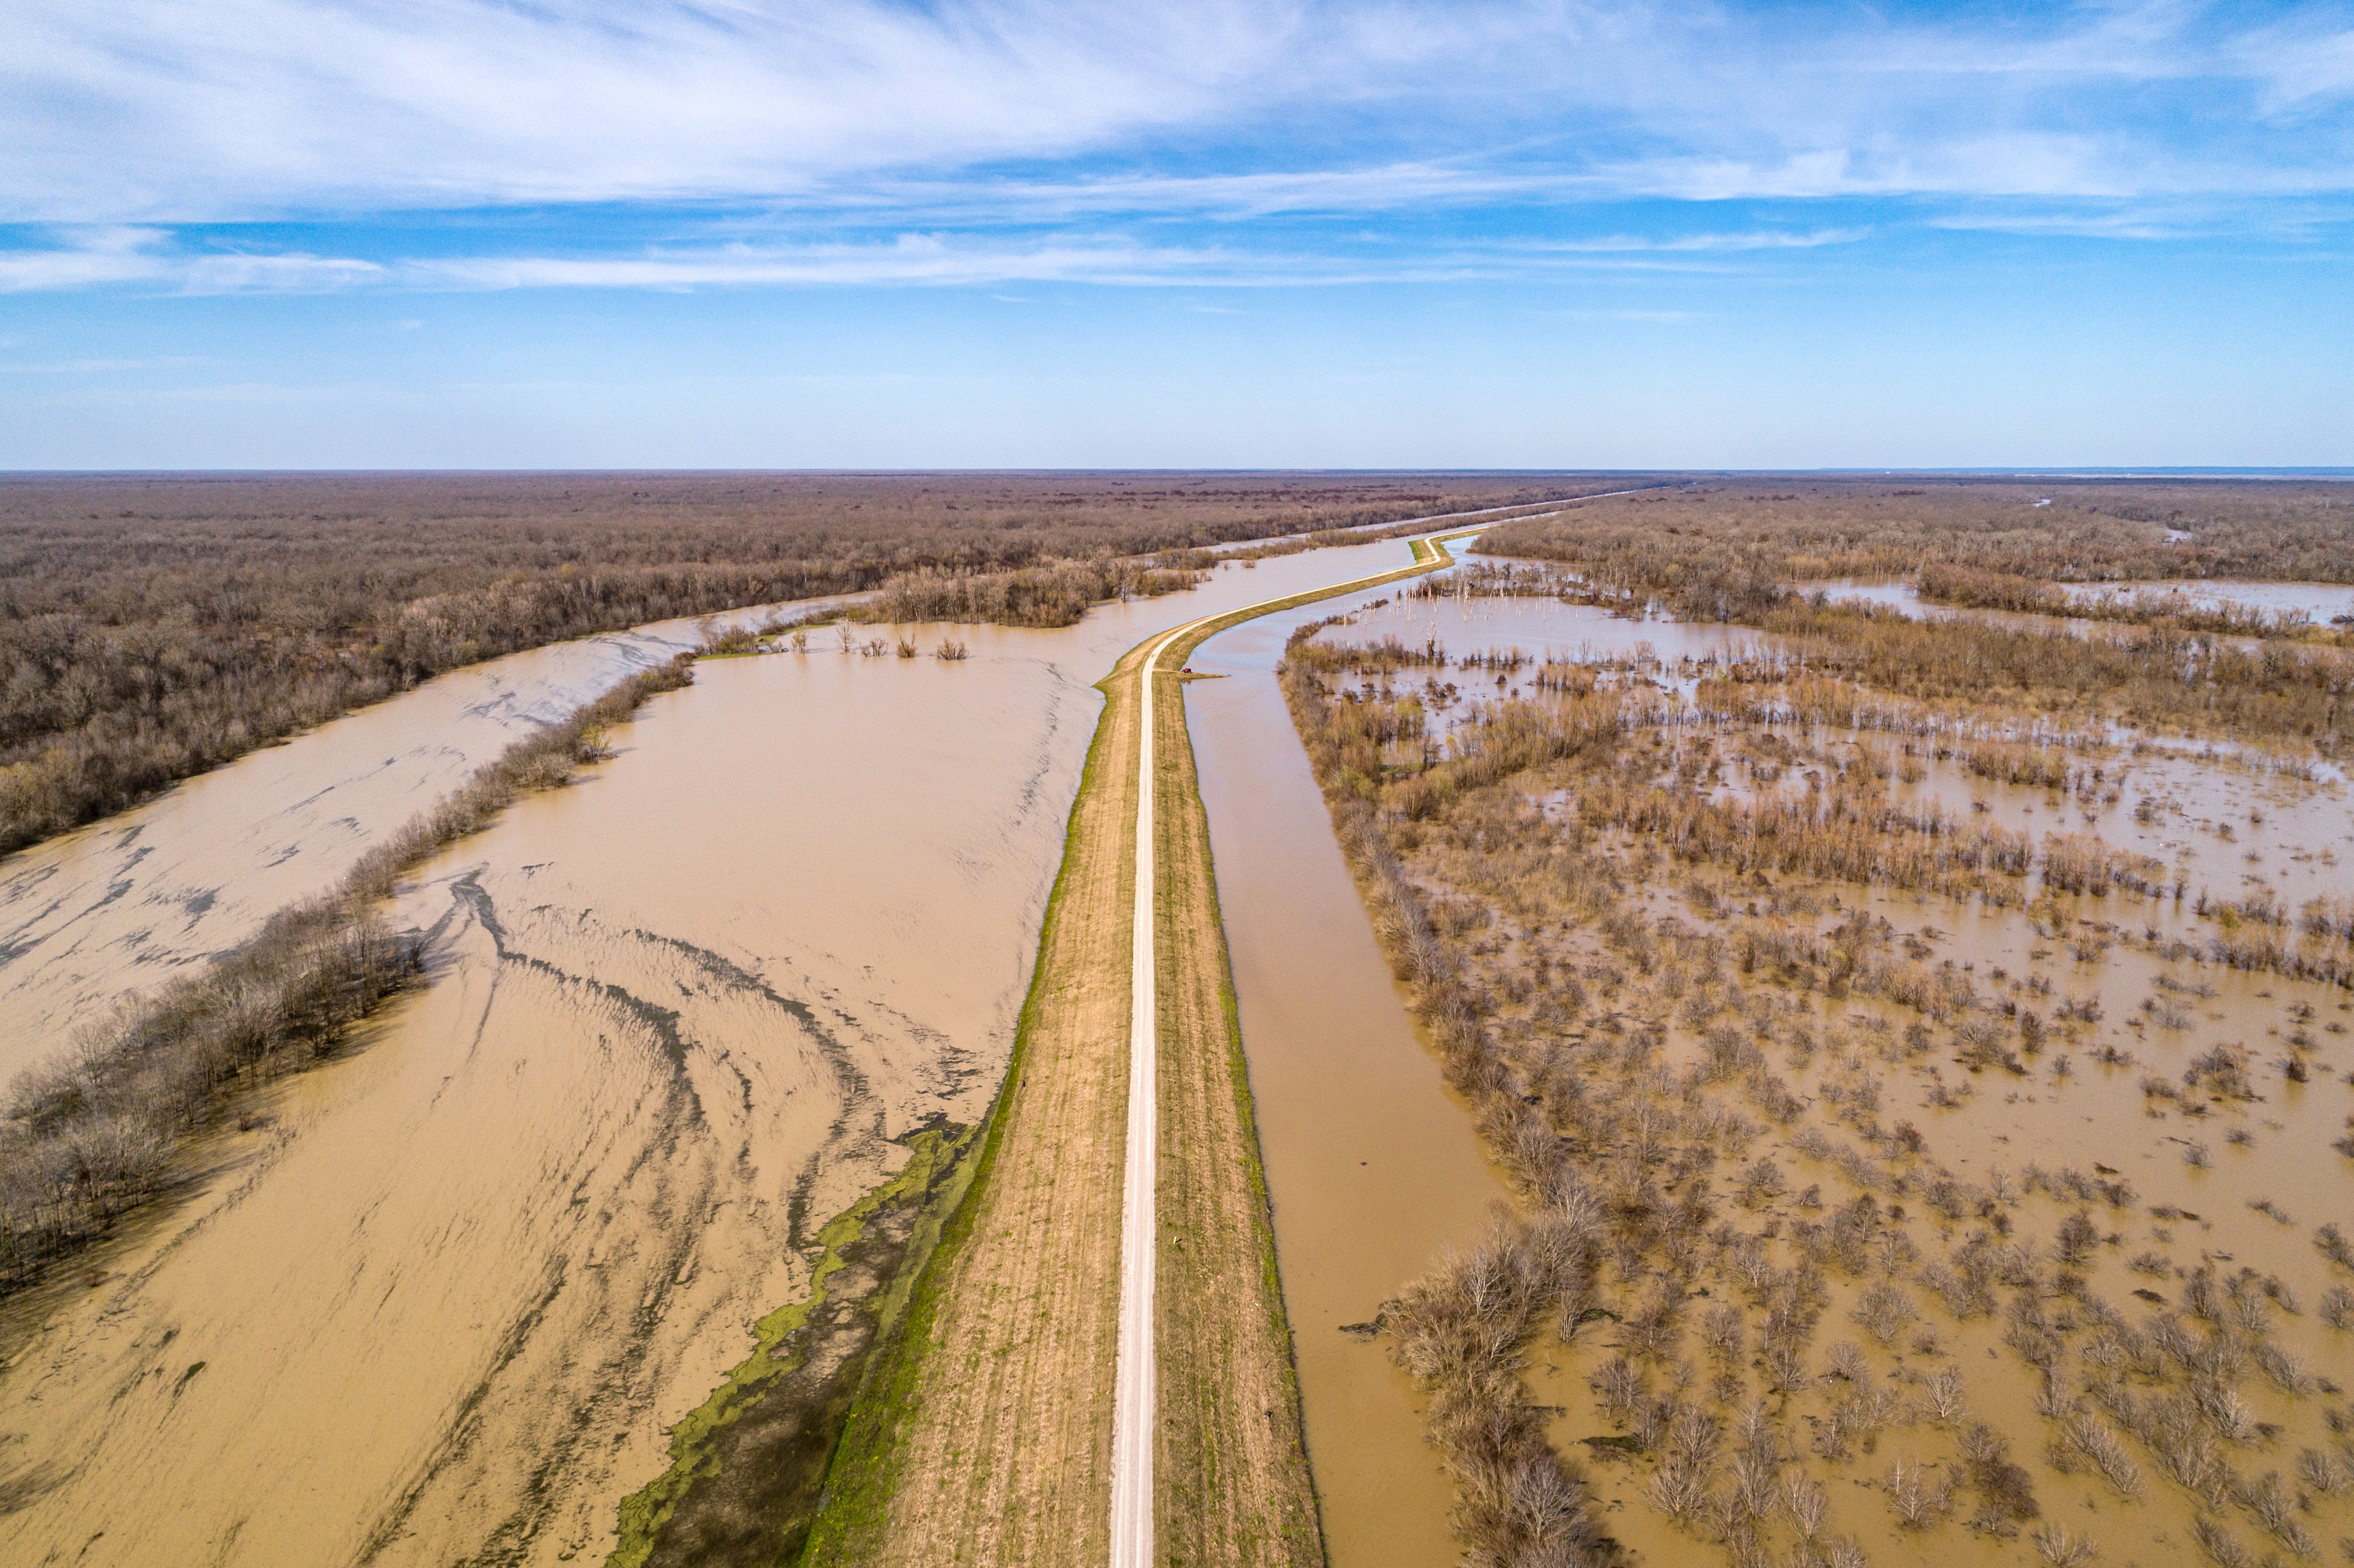
For low-lying coastal zones and small islands, sea-level rise (SLR) could cause frequent flooding, permanent submergence, salt-water intrusion and increased subsidence. SLR also increases the impact of extreme weather events like storm surges, which will push further inland than they did before.
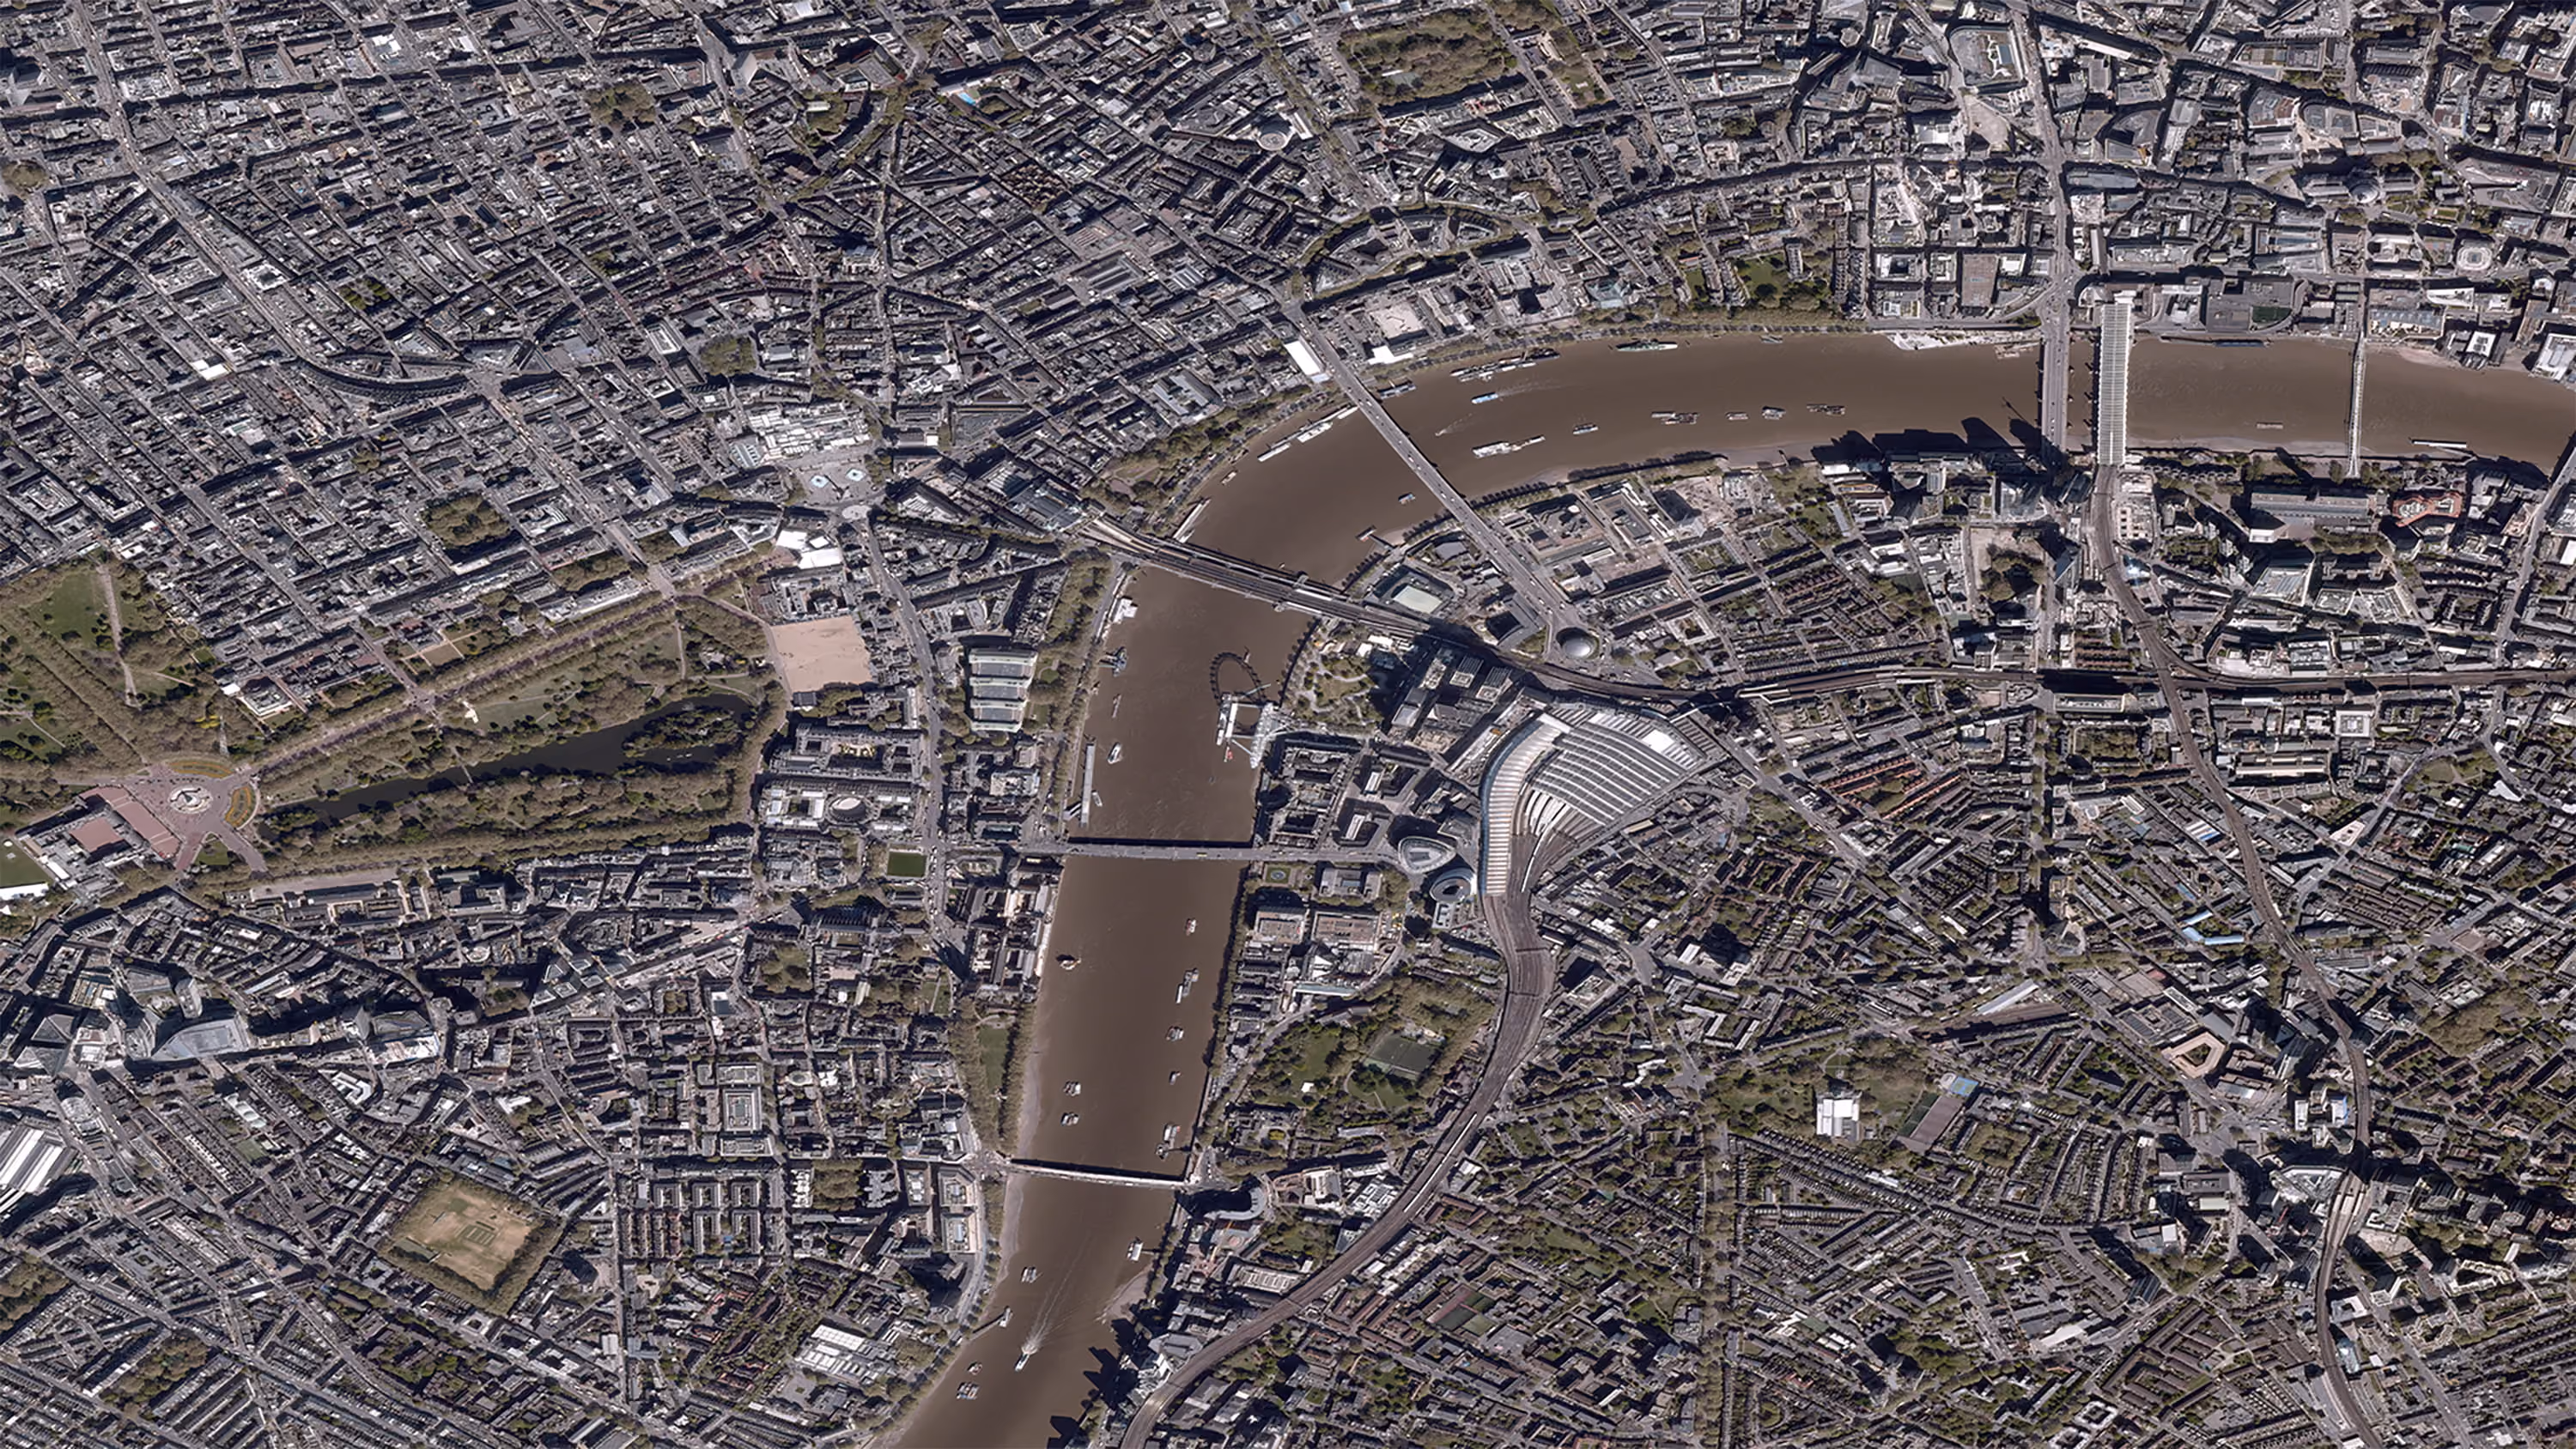
In urban areas, rising water levels put critical infrastructures such as roads, bridges, tunnels, railways, utilities and buildings at risk. With transportation, commerce, clean water and electricity all relying on these critical infrastructures, SLR will have economic consequences too.
A 2021 study estimates that permanent flooding could lead to a 0.19% drop in real GDP (assuming a 4.5 Representative Concentration Pathway (RCP)) by the year 2200.
Given that SLR is not uniform but varies regionally and locally, adaptation measures take different forms depending on the circumstance.
Choosing how to respond, therefore, starts with using decision support systems to assess future exposure and vulnerability to SLR.
SLR risk assessment requires elevation data which is collected using different sensors and methods. Examples are Synthetic Aperture Radar (SAR), tri-stereo imagery, or LiDAR. Digital Surface Models (DSMs) and Digital Terrain Models (DTMs) are the most common ways of representing the collected elevations.
Why are DSMs and DTMs important, and how are they used to assess SLR risks for critical infrastructure? Let's find out.
What are DSMs and DTMs (and why are they important)?
A Digital Surface Model (DSM) captures the elevation of natural and artificial features on the Earth's surface. It is used for the detection of buildings, trees, telecommunication towers, highways, and other ground features. DSMs allow the extraction of 3D data on critical infrastructure.
A Digital Terrain Model (DTM) represents elevations of the bare earth—free from natural and artificial features such as vegetation and buildings. DTMs are crucial for SLR modelling because the shape of the Earth’s surface affects how water flows over it.
Normalised DSM (nDSM) is a derivative product of DSM and DTM. It is obtained by subtracting the DTM from the DSM. Note that the DTM and DSM used should have a common horizontal and vertical datum.
The nDSM is important because it allows direct measurement of heights.
Find out everything you need to know about elevation models here.
Assessing SLR risks for critical infrastructure
Here are 4 broad steps highlighting how DSMs and DTMs are used to assess SLR risks.
Step 1: Determination of the local water level
The sea level varies geographically, i.e., depending on where you are, the sea level is different.
This variation gives rise to global mean sea level and regional (also known as local) sea level. What's the difference?
Note: Because of the regional/ local factors highlighted above, some areas may experience a higher SLR rate than that observed globally---hence regional relative SLR rates.
According to the 2019 IPCC Special Report on the Ocean, regional SLR differs by about 30% from the global average.
Regional/ local water levels should be applied in SLR risk assessment. With this in mind, regional water levels can be determined by either:
- Modelling the ocean surface based on local/ regional measurements at tide stations over a long time. Modelled sea level surfaces show the sea-level variations in the area of interest.
- Interpolating the water surface using values from nearby tide gauges, used where there are no tide gauges within the area of interest.
- Using a single value to represent the water level throughout the area of interest (known as a "bathtub" model). Used for small areas where there's only one tide gauge. High watermarks can also be adopted as a single value.
Since areas below high tide lines already experience submergence during high tides, the high water tide mark is often used as the reference water level. This ensures that SLR impacts are only mapped for areas where flooding is the exception rather than the norm.
Step 2: Selection of a reference datum
Water surface elevations are usually based on tidal datums, e.g. mean high water. As such, they must be converted to the vertical datum used by the DTM and DSM, e.g., ellipsoidal heights.
For the U.S., VDatum is a tool that can convert between tidal datums, orthometric heights and ellipsoidal heights.
Step 3: Determination of SLR values to model
SLR risks can be modelled for a range of SLR values to evaluate "what if" scenarios. These may be based on future SLR projections at a specific time.
For example, if the future SLR projection is 1.5mm/year, you may choose to evaluate SLR risks yearly over 10 years, where:
Future Sea Water Level = Existing Water Level (obtained in Step 1) + SLR Projection
For the reliability of the resulting flood model, the SLR value used must be more than the vertical error of the DTM. According to the National Oceanic and Atmospheric Administration (NOAA), the general guideline is that the modelled SLR value should be at least twice the vertical accuracy of the elevation data.
This is to say that to model SLR risks over shorter periods, you need an accurate DEM. Sources include:
- High-resolution aerial imagery like Hexagon Geospatial's aerial imagery which covers the United States, Europe and parts of Canada
- Tri-stereo high-resolution satellite imagery
- Synthetic Aperture Radar (SAR) data like that captured by TerraSAR-X satellite
Step 4: Modelling potential areas of flooding and identifying affected infrastructure
Subtracting the DTM from the Future Sea Water Level (obtained in step 3 above) results in a map showing:
- Areas at risk of flooding due to future SLR
- Flood depth represented as positive values in the raster
Note: For a more accurate risk assessment, it is important to ensure that the water flows across the surface of the DTM as it would in the real world. This is known as hydrologic connectivity. Hydrologic connectivity ensures that low-lying areas behind an obstacle are flooded if there is a channel connecting them to the ocean. Some examples of means to improve hydrologic connectivity include cutting road fills at drainage structures or stream burning on the DTM.
To identify the critical infrastructures affected and to what level (depth), the flood map obtained above is overlaid on the nDSM. Infrastructure that intersects the flood map is affected infrastructure and those that do not are non-affected infrastructure.
Find out how you can use OpenStreetMap data and UP42 to map the impact of flooding.
Factors to consider when using DTMs and DEMs to assess SLR risks
SLR increments
For coastal areas, which are generally flat, the accuracy of the DTM used is crucial because small sea-level changes can have a huge impact on the extent of critical infrastructures affected.
The quality of input elevation data determines the minimum increments in SLR and minimum projected timelines. For example, while several elevation models exist for large-area assessment of SLR risks, a 2018 study showed that the existing global DEMS are inadequate for mapping fine SLR increments of less than 1 meter or future forecasting of fewer than 100 years.
The table below highlights some sources of global elevation data and their characteristics.
Subsidence: Vertical land motion
Sea Level Rise (SLR) is not uniform globally but varies by region.
One reason for this is vertical land movements along coastal areas occasioned by:
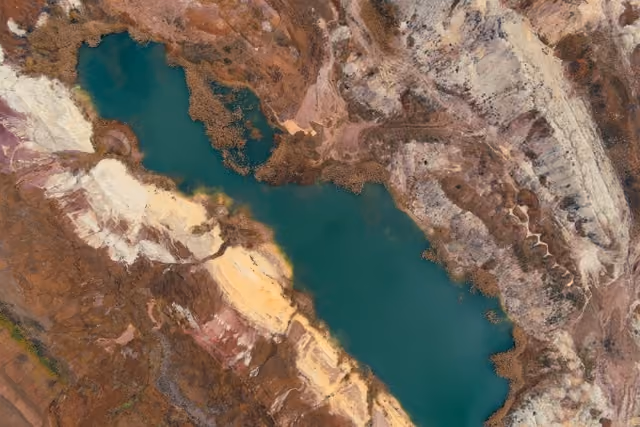
- Land subsidence or sinking, causing rapid sea-level rise relative to the coastline. Groundwater extraction and mining of oils and minerals can cause the land to sink.
- Land uplift whose effect is reduced sea level rise relative to the coastline. Uplift may be a result of tectonic plate movements or soil deposits.
For this reason, it is important to use an up to date DTM that captures changes in topography when assessing SLR risks. This is especially important for sinking coastal cities such as New Orleans, Bangkok, and Ho ChiMinh City.
Subsidence rates for long-term ground displacement can be obtained by using Interferometric Synthetic Aperture Radar (InSAR) methods such as Persistent Scatterer Interferometry (PSI) techniques.
Vertical bias of elevation data
Vertical errors found in global DEMs may lead to inaccurate SLR risk assessment, especially in densely vegetated and built-up areas. This is because global DEMs are DSMs that contain surface features like trees and buildings. Consequently, they tend to overestimate elevations i.e. positive vertical bias.
Nonetheless, freely available global DEMs makes them a cost-effective option for areas without LiDAR-based DEMs.
Some global DEMs may be more suited for modelling SLR risks in natural environments. And yet others may work better for urban areas. So, it is crucial to select a global DEM that best models SLR risks for the area of interest.
Various studies have assessed the suitability of different global DEMs for coastal flooding. We highlight a few of their findings below.
- An accuracy assessment of ASTER, SRTM, ALOS, and TanDEM-X DEMs for the island of Hispaniola found that TanDEM-X DTMs provide an effective approximation of LiDAR DTMs for coastal flood mapping in areas without LiDAR data.
- An analysis of the implications of using Global DEMs for flood risk analysis in cities found that global DEMs result in an inaccurate assessment of the extent and impact of flooding in cities---as compared to LiDAR data. The authors recommend using multiple global DEMs alongside each other to get a better picture of SLR impacts.
- Evaluation of the performance of freely available DEM products in different parts of the world with different topography and land cover concluded that the accuracy of the global DEMs depended greatly on the unique characteristics of each region.
Responding to the changing climate
Sea levels are rising. Mitigating SLR risks for critical coastal infrastructure calls for monitoring and modelling of SLR impacts and taking locally appropriate adaptation measures.
Geospatial data and analytics provide the means to identify, monitor and forecast SLR risks, informing policies on disaster preparedness and decision making.
At the same time, investment in climate tech across various industries is growing with PwC reporting that climate tech now accounts for 14 cents of every venture capital dollar. At the centre of climate tech business models is the need for frequent, high-quality earth observation data and analysis capabilities.
With continued advances in machine learning and cloud computing capabilities, geospatial technologies enable the analysis of huge volumes of past, present, and future satellite data to deliver insights for climate change mitigation and adaptation.
Got questions, or want to explore using the UP42 platform? Reach out to us. We'd be happy to help!

Subscribe to our newsletter
Stay up to date and learn about our fast-growing new features