


Editor's note: this article was originally published on March 12th, 2021 by Nikita Marwaha and Elizabeth Duffy. It was revised and updated on September 11th, 2025 by Kevin Enright and Mike Wang.
Our planet is a busy place—full of peaks, valleys, natural habitats, and human-made objects. Digital elevation data brings these highs, lows, and features into view.
By visualizing landscapes as elevation data, you can estimate areas most vulnerable to sea-level rise, spot vegetation encroachment, and avoid problems (real ones, or just eyesores) during urban planning.
There are lots of ways to model elevation. The term Digital Elevation Model is often used as a blanket term, encompassing Digital Surface Models and Digital Terrain Models. We'll explain all of these in detail. Starting with...
What are Digital Elevation Models?
A Digital Elevation Model, also known as a DEM, is a grid of the Earth's surface in the form of a raster GIS layer. This means that it represents a surface as a pixel grid, with each pixel having its own elevation value.
How do you create DEMs?
To get elevation data, a single standard optical image usually isn't sufficient. You need a way to capture depth. Here are some of the most common methods.
-
SAR interferometry (aka. InSAR): This method uses sythetic aperture radar (SAR) to collect multiple radar images of the same area from different angles to build a 3D representation.
-
Stereo Photogrammetry: Similar to InSAR, but done through multiple captures of the same area via an optical sensor mounted on a satellite, plane, or drone.
-
LiDAR (aka. Laser Altimetry): LiDAR sensors fire lasers and measure the reflected light to determine the elevation of the Earth’s surface. Instead of a raster grid, this method usually creates a point cloud, which provides less uniform data. But point clouds can be converted into raster grids for easier processing.
-
Digitizing contour lines: by using an existing contour map, you can extract elevation data with GIS software.
-
Ground surveying: by assessing known XYZ positions, neighboring areas are measured using a device called a theodolite. This method isn't easy: it requires skilled labour, lots of hours, and very careful inputs.
There are different subtypes of DEMs, as you may have guessed from this article's ridiculously long title. The two main ones are DSMs and DTMs.
What are Digital Surface Models (DSMs)?
A Digital Surface Model captures a surface along with all natural and human-made structures, such as vegetation and buildings. They illustrate reflective surfaces of all features elevated above the Earth's surface.
In short, DSMs represent the ground and all objects on it.
Common applications of DSMs
Because DSMs represent the surface and all of its above-ground features, they're important in urban planning, especially as already built-up areas change over time.
DSMs are ideal for runway approach zone encroachment in aviation, which means detecting the safest landing routes for planes. Beyond that, DSMs can be used for visualization, disaster management, navigation, vegetation management, decision-making, and much more.
What are digital terrain models (DTM)?
Digital terrain models represent the Earth's surface without any natural or man-made features.
Across different countries, governments, and companies, the definitions of these three models can vary. But most widely, DSMs include natural and man-made features, while DTMs do not.
The differences between DEMs and DTMs are most evident in heavily developed urban areas with many high-rise buildings.
Places like Manhattan or Hong Kong Island can significantly influence how the terrain should be measured and how much elevation data may need to be corrected to remove the influence of objects on the surface.
How are DTMs created?
DTMs can be created through various methods, including digitized contours and even from DSMs using the difference between the height values for trees and buildings and their local neighborhood.
Therefore, DTMs can also be created from any of the methods used to generate DEMs, from LiDAR to stereophotogrammetry, as well as InSAR, DGPS, and ground surveying, all at varying levels of detail.
So, how are DSMs different from DTMs?
The figures below illustrate how DSMs differ from DTM .
A DSM captures both natural and human-made features of the environment.
But as shown below, a DTM only keeps natural terrain features, such as rivers and ridges.
 source: heliguy.com
A DTM can be derived from a DSM, but not the other way around.
The combination of DSM and DTM to create height information of the above ground features is generally called creating a nDSM (normalised digital surface model). The math for it is quite simple and intuitive: DSM - DTM = nDSM. We dive into this topic in a separate blog post.
Quality and accuracy of DEM/DTMs
Several factors influence the quality of DEM-derived products:
- Vertical resolution
- Terrain roughness
- Sampling density and resulting spatial resolution or pixel size
- Terrain analysis algorithm
- Interpolation algorithm
- Reference 3D products with quality masks containing information on the coastline, snow, clouds, water bodies, etc.
Common applications of DEMs
DEMs are often used in infrastructural management, hydrology and flow-direction studies, and land-use planning.
They're especially useful across greater spatial scales for the contouring of topographic and relief maps:
- Modeling water flow or mass movements (e.g., landslides)
- Creating physical models (such as raised-relief maps)
- Rectifying aerial photography or satellite imagery
- Rendering 3D visualizations
- Reducing (terrain correction) gravity measurements (e.g., gravimetry, physical geodesy)
- Analyzing terrain in physical geography and geomorphology
Before we move on to where to find elevation data, let’s recap the differences between the three types:
-A Digital Elevation Model (DEM) is a term for an elevation model, which covers both DSMs and DTMs. Often, because of scale and environment, differentiation between DSM and DTM is unnecessary, (Elevation models created from low spatial resolution data sources wouldn't be able to pick up small differences anyway).
-
A Digital Surface Model (DSM) is an elevation model that captures both the environment’s natural and artificial features. It includes the tops of buildings, trees, powerlines, and any other objects. Commonly, this is seen as a canopy model and only detects the ground where there is nothing else above it.
-
A Digital Terrain Model (DTM) is a bare-earth elevation model. DTMs do not contain any features above the bare-earth, even persistent ones. Thus, they can be paired with DSMs to derive height information regarding objects on the surface. DTMs are often used to augment DEMs.
Where can I find DEMs?
There are plenty of places to find global DEMs. From free satellite data to LiDAR sources, here’s how to find the elevation data you need.
1. The UP42 marketplace: Intermap’s NEXTMap & Airbus’ WorldDEM and WorldDEM4Ortho
What, did you think were going to be subtle about plugging our own platform?
If you're unsure which provider to go for, we've got many of the world's best.
The UP42 platform has elevation data from Airbus, BlueSky, Hexagon, Intermap, Planet, and Vexcel.
Of particular note is the WorldDEM4Ortho data from Airbus, which is specially tailored to orthorectification use cases.
2. Space Shuttle Radar Topography Mission (SRTM)
During its 11 day mission in 2000, the space shuttle Endeavour orbited the Earth 16 times and captured Earth’s topography at one arc-second (30 meters) for over 80% of the Earth’s surface.
SRTM used synthetic aperture radar and interferometry to collect one of the most accurate digital elevation models of Earth. The SRTM payload, launched in 2000, used two radar antennas and a single pass to generate a digital elevation model using the technique known as interferometric synthetic aperture radar (inSAR).
This data is freely available for you to use on the USGS Earth Explorer. It covers most of the world with an absolute vertical height accuracy of less than 16m. While it's now fairly old and of lower resolution, it's still useful for many areas around the world.
Where can you download the SRTM data?
If you want to download SRTM datafrom the USGS Earth Explorer, select your area of interest. Under the data sets tab, select Digital Elevation>SRTM>SRTM 1-ArcSecond Global.
This handy guide by GIS Geography will help get you started.
2. ASTER Global Digital Elevation Model
The Advanced Spaceborne Thermal Emission and Reflection Radiometer (ASTER) is a joint operation by NASA and the Ministry of Economy, Trader, and Industry (METI) of Japan. As a part of this, the ASTER Global Digital Elevation Model (GDEM) was born.
With a global resolution of 90 meters and 30 meters in the United States, ASTER GDEM has high resolution and wide coverage—around 80% of the Earth.
How did the ASTER GDEMs come to be? Using stereoscopic pairs and digital image correlation methods. Based on two images at different angles, it measured elevation using stereo pairs and photogrammetry.
Something to note: some users expressed issues with its data, often in cloudy areas.
However, over time, ASTER DEM data has improved its products with artifact corrections leading to considerable improvements.
Some now consider ASTER GDEM-2 to be a more accurate representation than the SRTM elevation models in rugged mountainous terrain. But, go ahead and take a look and see for yourself.
Where can you download the ASTER GDEM?
You can download the ASTER DEM data for free from NASA Earthdata, Japan Space Systems, and the USGS Earth Explorer by selecting Digital Elevation > ASTER.
3. JAXA’s Global ALOS World 3D
ALOS Global Digital Surface Model, or ALOS World 3D, is a global DSM dataset by the Japanese Aerospace Exploration Agency (JAXA).
It is generated from images collected using the Panchromatic Remote-sensing Instrument for Stereo Mapping (PRISM) aboard the Advanced Land Observing Satellite (ALOS) from 2006 to 2011. The DSM dataset has a horizontal resolution of approximately 30-meter mesh (1 arcsec) and is available to the public for free.
Where can you download JAXA’s Global ALOS 3D World?
To access this accurate DSM, you’ll have to register online through the JAXA Global ALOS portal to download it.
4. Light Detection and Ranging (LiDAR)
As the world has moved towards a global LiDAR map, LiDAR data sources are available online for free—if you know where to find them.
Why LiDAR? Its spatial and vertical accuracy is often unparalleled. After you filter ground returns, you can build an impressive DEM from LiDAR data. You can often use the different returns to determine the height of vegetation vs. the height of the ground surface, depending on the LiDAR instrument and the density of the vegetation- thus, you can yield both a DTM and a DSM from the same dataset!
Some great LiDAR data sources include Open Topography, USGS Earth Explorer, and NEON Open Data Portal.
If you’re still looking for LiDAR data over your area of interest, try contacting your local or regional government. As long as you tell them what you’re using it for, they may share their LiDAR data for free.
How can you access, open and read DEMs?
Software tools such as QGIS enable you to open and read DEM files.
What format are DEMs in?
With the abundance of elevation data available online, once you’ve found the right one for your needs, it’s time to dive right in.
As we now know, DEMs are files that contain either points (vector) or pixels (raster), with each point or pixel containing an elevation value. They come in a variety of file formats, from .csv and .tif to .flt and .dem.
Here’s a helpful guide by Carleton University on DEM formats and how you can open them in various tools.
Speaking of tools, let’s look at those next.
What software tools do I need to open and read DEMs?
You’ll need a Geographic Information System (GIS) or other special application software since elevation data is not directly viewable in a browser. Some software programs that recognize DEM files include:
-
ArcGIS—here’s a helpful guide on exploring DEMs using ArcGIS—create elevation layers and more
-
QGIS is in 3D and brings a whole new set of cartography possibilities. It’s also free and open-source, making it easy to understand how its algorithms work
-
gVSIG—another free tool, this time with CAD tools, a NavTable, and a mobile application
-
GRASS GIS—a free option with an intuitive UI and over 350 vector and raster manipulation tools
Keep in mind: beforehand, digital elevation data and images are usually unedited and intended for scientific use and evaluation.
They are outputs directly from the data source itself, so they may contain:
- Numerous areas without data
- Ill-defined coastlines
- Water bodies that may not appear flat
- Other errors already discussed.
What are the basics of DEM analysis?
DEM analysis includes four essential components, namely:
- Data acquisition: capturing terrain images or scanning the earth surface
- Data modeling: interdisciplinary approaches such as image processing, photogrammetry, interferometrics, etc.
- Data management: data coding, data structuring, spatial database technique, computer graphics
- Application development: urban planning, mine management, surveying, geomorphology analysis, facility management, civil engineering, resource management, geological engineering, landscape design, hazard identification and monitoring, and even computer games and missile/airplane navigation
The uses and applications of DEMs are even more varied than how they are acquired. Relevant and useful for almost any industry or sector that uses location data, some of the general uses include:
- Slope analysis
- Aspect analysis
- Delineating drainage networks and catchments
- Identifying geologic structures
- Viewshed analysis
- 3D simulations
- Change analysis
- Orthorectification
- Contour mapping
What data do you need to build digital elevation models?
The key to building DEMs is, you guessed it, elevation data (Z) that’s defined spatially (in X and Y).
This elevation is always normalized in reference to some arbitrary datum in the landscape, generally mean sea level.
This means there has to be a known and consistent reference point of observation and a consistent method of measurement of the area being assessed.
How the elevation data points were acquired (see capture methods in the previous section) determines what corrections need to be made and how the points should be interpolated.
Satellites offer both the known observation point—with their consistency of orbit and all the metadata that comes with each image, such as the orbit file with track information and the angle of incidence—as well as the consistent methodology of acquisition, scanning relatively continuously over an area and uniformly measuring elevation.
When it comes to DEMs derived from satellite data, a crucial differentiation is made between the methods of using sets of optical imagery for stereoscopic analysis vs. using radar information for interferometric analysis.
What is the accuracy of digital elevation models?
DEM accuracy is most commonly estimated by calculating the Root Mean Square Error (RMSE) of elevation computed by comparing DEM points and reference points.
However, there’s much more to a DEM’s accuracy than just the elevation (vertical) component.
What factors affect DEM accuracy?
The DEM quality depends on various interrelated factors such as data acquisition methods, the nature of input data, and techniques employed to develop the DEM.
Different acquisition methods of elevation data, from manual methods like DGPS to passive methods like stereoscopic satellite images to active RADAR or LiDAR acquisitions, have their own biases and sources of error to look out for.
For example, manual methods will be prone to sampling bias and rarely have atmospheric influence or other common biases seen in other acquisition techniques.
Let’s look at some of the key factors that affect DEM accuracy for non-manual methods:
- Atmospheric and ionospheric influence
- Temporal decorrelation
- Coregistration errors
- Phase errors and signal decorrelation
- “Shadow” effects
DEM resolution
There are three main types of resolution that one should always consider when assessing the fit of a DEM for a given project or application: spatial resolution and vertical resolution.
- Spatial resolution
Spatial resolution is determined by the distance between sample points, which can be relatively uniform, such as in the case of stereoscopic imagery, somewhat uniform, such as with RADAR and LiDAR, or highly variable, such as with DEMs obtained with manual methods.
- Vertical resolution
One of the most important aspects of a DEM is its vertical accuracy or vertical resolution.
The vertical resolution of elevation data is defined as the possible height difference between the modeled or detected elevation and the actual or ground-truthed elevation of the surface.
Each of the various aforementioned methods of obtaining elevation data, such as radar, LiDAR, or photogrammetry, produces differing accuracy levels. Of these methods, LiDAR generally yields the best spatial and vertical resolutions, yet, it is often prohibitively expensive at scale.
- Temporal resolution
One last resolution one may want to consider before choosing a DEM is the temporal resolution, namely, how recently was the elevation data used to generate the DEM acquired.
This is particularly relevant if you'd like to conduct some change analysis or if you are using a DSM to study something fairly temporally variable like vegetation or new construction.
How to read vertical errors in DEMs
Vertical errors in DEMs are usually classified as sinks or peaks.
What is a sink?
A sink is an area surrounded by higher elevation values. It’s also referred to as a depression or a pit—an area of internal drainage.
Where do they come from? Some sinks may be natural, particularly in glacial areas, although many sinks are often imperfections in the DEM.
What is a peak?
On the other hand, a peak, also known as a spike, is an area surrounded by cells of lower value.
These are usually natural features and are less detrimental to the calculating flow direction, as mentioned above.
Where do sinks and peaks come from?
The number of sinks in a given DEM usually is higher for coarser-resolution DEMs.
Sinks are also commonly caused by storing the elevation data as an integer number. This can cause issues in areas of low vertical relief.
Often, you may find 1% of cells in a 30-meter resolution DEM to be made up of sinks. This can increase as much as 5% for a three arc-second DEM.
You may notice another kind of error in DEMs known as striping artifacts—contained within DEMs resulting from systematic sampling errors when creating the DEM itself. This is also most noticeable on integer data in flat areas.
How to remove sinks and peaks to create a depressionless DEM
When faced with sinks and peaks in DEMs it’s important to remove or fill them—to create a depressionless DEM.
A DEM free of sinks is the derived input to the flow direction process, for example. This is because the presence of sinks may lead to an erroneous flow-direction raster.
Using a depressionless DEM is key to ensuring accurate analysis.
Many GIS applications include tools for you to create a depressionless DEM, enabling you to:
- Identify sinks
- Fill sinks
- Find sink depth
Here’s a guide by ArcGIS Pro on how to do just that by using the ArcGIS Spatial Analysis extension toolset.
Hydrology applications with DEMs
Floodings and DEMs: Flood Inundation Models
DEMs can be used to perform many geospatial and hydrological modeling.
Ranging from flood prediction and the physical development of urban and rural areas to watershed delineation and flood impact analysis for emergency preparedness.
Flood inundation modeling or flood inundation mapping is required to understand the effects of flooding in a particular area and on important structures such as streets, buildings, roads, and railways.
Quantifying the risk of flooding through flood models predicts inundation extents. This can be a crucial source of information for flood risk studies—especially as our world warms and sea levels rise.
Flood inundation models provide us with important information such as depth and the spatial extent of flooded zones—required by local authorities to inform citizens about significant flood-prone areas and adopt appropriate flood management strategies.
Accurate flood models require high resolution and highly accurate DEMs. According to this paper from 2019, current global DEMs do not capture the topographic details in floodplains—often leading to inaccurate prediction of flood extends by flood models (Shastry & Durand, 2019).
These data-scarce regions can be studied by creating flood inundation maps produced by combining flood extents with prediction modeling and modified DEMs.
Learn more about utilizing flood inundation observations to obtain floodplain topography in data-scarce regions in the paper.
DEM errors in flood models
It’s important to consider the DEM data source when using DEM to predict flood risk. This study looks at assessing coastal flooding, seal-level rise, or erosion risk and explores the role of DEM data source.
Other applications of DEMs
Applying machine learning algorithms to DEMs
As mentioned, data-scarce areas exist, and to fill these voids, data modeling can be done. In recent years, advances in machine learning algorithms, affordable computing power, and big data availability has spurred the deep learning revolution across domains.
Machine learning techniques such as image inpainting can be used to fill data voids (Gavrill & Muntingh et al, 2019).
Image inpainting, similar to the term used in the art world to conserve damaged or incomplete images, image inpainting algorithms reconstruct terrain pixels in missing areas.
It suggests that while DEM accuracy and spatial resolution are usually considered before being used for flood models, DEMs’ limitations arising from their original data source can often be overlooked during DEM selection (Coveney & Fotheringhham, 2011).
Topographic maps and DEM mapping
Elevation data can be used as an input to infrastructure projects, ensuring the construction of railways, pipelines, and power lines are not planned across high-slope areas.
Differences in elevation can also be tracked to ensure that geological hazards are monitored, predicted, and mitigated—minimizing damage and outages.
The National Geospatial-Intelligence Agency has teamed up with the University of Illinois, the University of Minnesota, and Ohio State University to produce digital elevation models of the world through Earth DEM.
The project feeds satellite images of an area from multiple angles into the Blue Waters supercomputer to create 3D models of the terrain.
As one of the most powerful and fastest supercomputers in the world, Blue Waters can perform over 13 quadrillion calculations per second.
EarthDEM will be a publicly available, 3D map of the globe and follows the complete mapping of the Arctic in 2017, as part of the ArcticDEM project—which helped scientists track changes, detect deforestation, ice cap collapse, and more.
Geologic studies and DEM mapping
The East African Rift System
Digital elevation models provide geologers with insights into tectonic plate boundaries. In the image above of East Africa, the outlines of the elevation highs demonstrating the thermal bulges and large lakes in East Africa are visible.
Scientists used DEM data to uncover and predict rift-to-ridge transition—leading to a new ocean formation as the African continent splits in two. The East African Rift system stretches from the Afar region of Ethiopia down to Mozambique. It’s an active continental rift that began millions of years ago and splits at 7mm annually.
In the recent study, the Victoria microplate, which lies between the eastern and western branches of the East Africa Rift System, was found to be rotating counterclockwise for the last two years with respect to the African Plate.
As well as these insights into the continents, regular eruptions of volcanoes along the rift adds to the belief that the continent may be splitting to form a new ocean.
Meteorite impact crater in Greenland
ArcticDEM data supported the investigation of a possible second impact crater buried under more than a mile of ice in northwest Greenland.
Following the November 2019 announcement of a 19-mile wide crater beneath Hiawatha Glacier—the first meteorite impact crater ever discovered under Earth’s ice sheets—the second crater has a width of over 22 miles.
NASA glaciologist Joe MacGregor checked topographic maps of the rock beneath Greenland’s ice for signs of craters. He used imagery from NASA’s MODIS instrument and noticed a circular pattern around 114 miles southeast of Hiawatha Glacier.
By studying high-resolution DEM data of the entire Arctic using ArcticDEM, he noticed the same circular pattern—leading him to suspect a possible second impact crater.
Archeology and DEMs
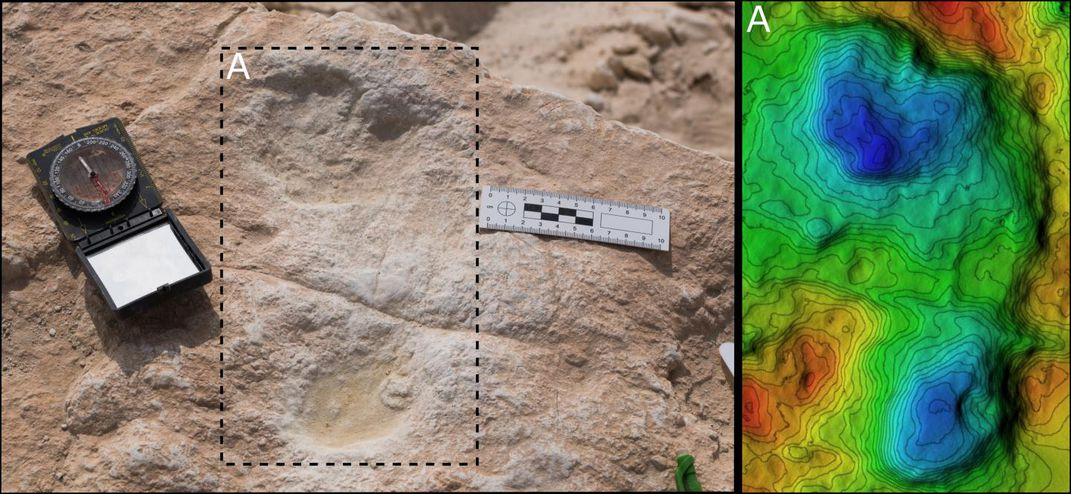
DEM data is incredibly useful for delving into the past. When archaeologists scoured the Nefud desert in northern Saudi Arabia, they examined 376 footprints left in the mud of an ancient lake bed.
Among the footprints left by animals such as giant extinct elephants, camels, buffalo, and ancestors of modern horses, they spotted human footprints that may testify to humans’ presence in the region some 115,000 years ago.
Analysis using digital elevation models of three selected hominin tracks argues that anatomically modern humans created the seven footprints. If confirmed, these would be the oldest traces of Homo sapiens ever found on the Arabian Peninsula.
DEM data for other planets
Mars Orbiter Laser Altimeter (MOLA)
Mapping our own planet isn’t where it ends. Thanks to the Mars Orbiter Laser Altimeter (MOLA) instrument, you can view the rugged terrain of Mars.
The instrument onboard the Mars Global Surveyor (MGS), a spacecraft launched on 7 November 1996, collected altimetry data until 30 June 2001. Alongside this, a laser altimeter onboard MGS determined the height of surface features on Mars.
Starting in 1998, MGS made pole-to-pole observations of the red planet. It’s goal? To map the entire Martian globe, laying the foundation of over ten more years of NASA missions. To determine the geology and perhaps history of Mars and its climate.
Scientists used MOLA to map out ancient Martian streams and explore what might have been. MOLA works by measuring the time that a pulse of light takes to leave the spacecraft, reflect off the surface of Mars, and return to MOLA’s collecting mirror. By multiplying the reflection time by the speed of light, scientists calculated Surveyor’s altitude above the local terrain to within around 30 meters.
As the spacecraft flew over hills, valleys, and craters, its altitude above the ground continuously changed. Such detailed maps help us construct a topographical atlas of the planet and understand the geological forces that shaped Mars.
Explore the contours of our planetary neighbor in this Mars Terrain map and through the USGS Astrogeology Science Center
Summary: DEMs, DSMs, & DTMs
To summarize, a Digital Elevation Model or DEM is a generalized term for a raster data set with a regular grid of elevation information. DEMs are popular for calculations, manipulations, and further analysis of an area, and analysis based on the elevation.
Digital Surface Models or DSMs capture a surface—including natural and human-made structures such as vegetation and buildings. They illustrate reflective surfaces of all features elevated above the ‘bare earth’.
Lastly, Digital Terrain Models or DTMs are a bare-earth elevation model, and therefore free of vegetation, buildings, and other above-ground objects.
There are plenty of places to find global DEMs. From free satellite data to LiDAR sources. They come in a variety of file formats, from .csv and .tif to .txt and .dem. You’ll need a Geographic Information System (GIS) or other special application software since elevation data is not directly viewable in a browser. Some software programs that recognize DEM files include ArcGIS and QGIS
DEMs can be used to perform many geospatial and hydrological modeling—including flood prediction and flood impact analysis for emergency preparedness.
Machine learning algorithms can be applied to derive more from DEM data—such as image inpainting to fill data voids and complete the picture.
Elevation data can be used as an input to infrastructure projects, geology studies, archaeological findings, and exploring planets other than our own such as Mars.
Ready to try it out for yourself? Create your own account for the UP42 platform.
Key takeaways
-
DEM (Digital Elevation Model) is a broad term: DSMs (surface + objects) and DTMs (bare-earth) are the main types, and subtracting a DTM from a DSM of the same area provides object heights.
-
DEMs are created using methods like InSAR, stereo imagery, LiDAR, contour digitization, and ground surveys.
-
The quality of a DEM depends on spatial/vertical resolution, processing methods, and artifact handling (for example, sink filling, error correction).
-
Applications include flood modeling, urban planning, geology, archaeology, and many other 3D visualization use cases.
-
Data access: Free global datasets (SRTM, ASTER, ALOS), regional LiDAR, and commercial products are available in GIS-friendly formats. For more detailed DEMs, or to task a provider to create a new one, you can use the UP42 platform.


