The reality is, things change.
Even the Earth's surface changes, naturally. It uplifts and subsides unevenly in different parts of the world.
Buildings, dams, bridges, embankments, and other infrastructure are no different. They are subject to varying external loads and ground changes that may cause them to deform.
While some types of deformation, like expansion caused by temperature rise, may be normal, abnormal deformation such as that caused by strong winds, earthquakes, or floods may be disastrous.
As such, it is important to monitor trends in the movement of infrastructure and the surrounding ground to detect early warning signs and prevent disasters.
There are terrestrial and satellite methods of infrastructure monitoring.
Terrestrial methods using total stations, spirit levels, and GPSs provide accurate and reliable measurements at key points on the infrastructure. Nevertheless, they have a few shortcomings.
They are time-consuming, labor-intensive, and expensive. Further, to catch displacements on a larger scale, it would be necessary to cover the ground with instruments. Such a density is not realistic.
Fortunately, radar interferometry can be leveraged alongside surface instruments, such as GPS receivers, to enhance and scale insights.
With radar interferometry, it is possible to study displacement---even in remote regions---by analyzing time series of synthetic aperture radar (SAR) acquisitions.
 Source: UP42 Webinar
Using radar interferometry for infrastructure monitoring offers several advantages, including:
-
SAR sensors are not limited by weather or the time of day
-
Historical data are useful to track previous deformation rates when past survey data is lacking
-
It is a cost-effective method for consistent and frequent monitoring of large areas
In this blog post, we are going to focus on how a stack of SAR images is used to measure millimeter deformation movements using a technique known as Persistent Scatterer Interferometry (PSI).
Before we begin, we will look at what interferometry is and provide an overview of InSAR and DInSAR techniques.
What is interferometry, and what are its uses?
Imagine a perfectly still pond. Drop two pebbles side by side into it, and each produces circular ripples expanding outwards. At some point, the two sets of ripples overlap.
Where two wave crests or troughs of the ripples meet, the height of the wave doubles—we call this constructive interference. However, if the crest of one wave meets the trough of another, they cancel each other out. This is known as destructive interference.
Interferometry is based on the principle of interference whereby interference patterns are used to extract specific characteristics of the target objects.
Interferometry finds application in various fields, among them studying space (astronomy) and observing the Earth (Earth Observation, EO).
In astronomy, interferometry is used to capture high-resolution images of astronomical bodies such as the moon, stars, or galaxies using telescopes.
For EO applications, airborne or space-borne radar sensors transmit microwave signals to the Earth's surface and record both amplitude and phase of the backscattered signals in SAR images.
Two SAR images of the same area captured from different viewing angles will have a time or phase difference between corresponding pixels. Phase difference is the time by which a wave either falls behind or leads compared to another wave. It occurs because the microwaves travel different path lengths to the target due to:
-
Terrain/ altitude differences between objects
-
Ground/ object deformation between observations
-
Differences in atmospheric conditions, such as temperatures, humidity, and pressure between signal paths
 Phase difference between two SAR acquisitions due to ground subsidence. Source: Schindler et al., 2016 (CC BY 4.0)
As a result, interferometry is leveraged to detect shifts on the Earth's surface. Deformation can be sudden (e.g. caused by volcanic activity or landslides) or slow and subtle (e.g. due to land subsidence and uplift). Differential interferometry (DInSAR) is suited for measuring sudden deformation, while PSI is used to monitor slow and subtle movements.
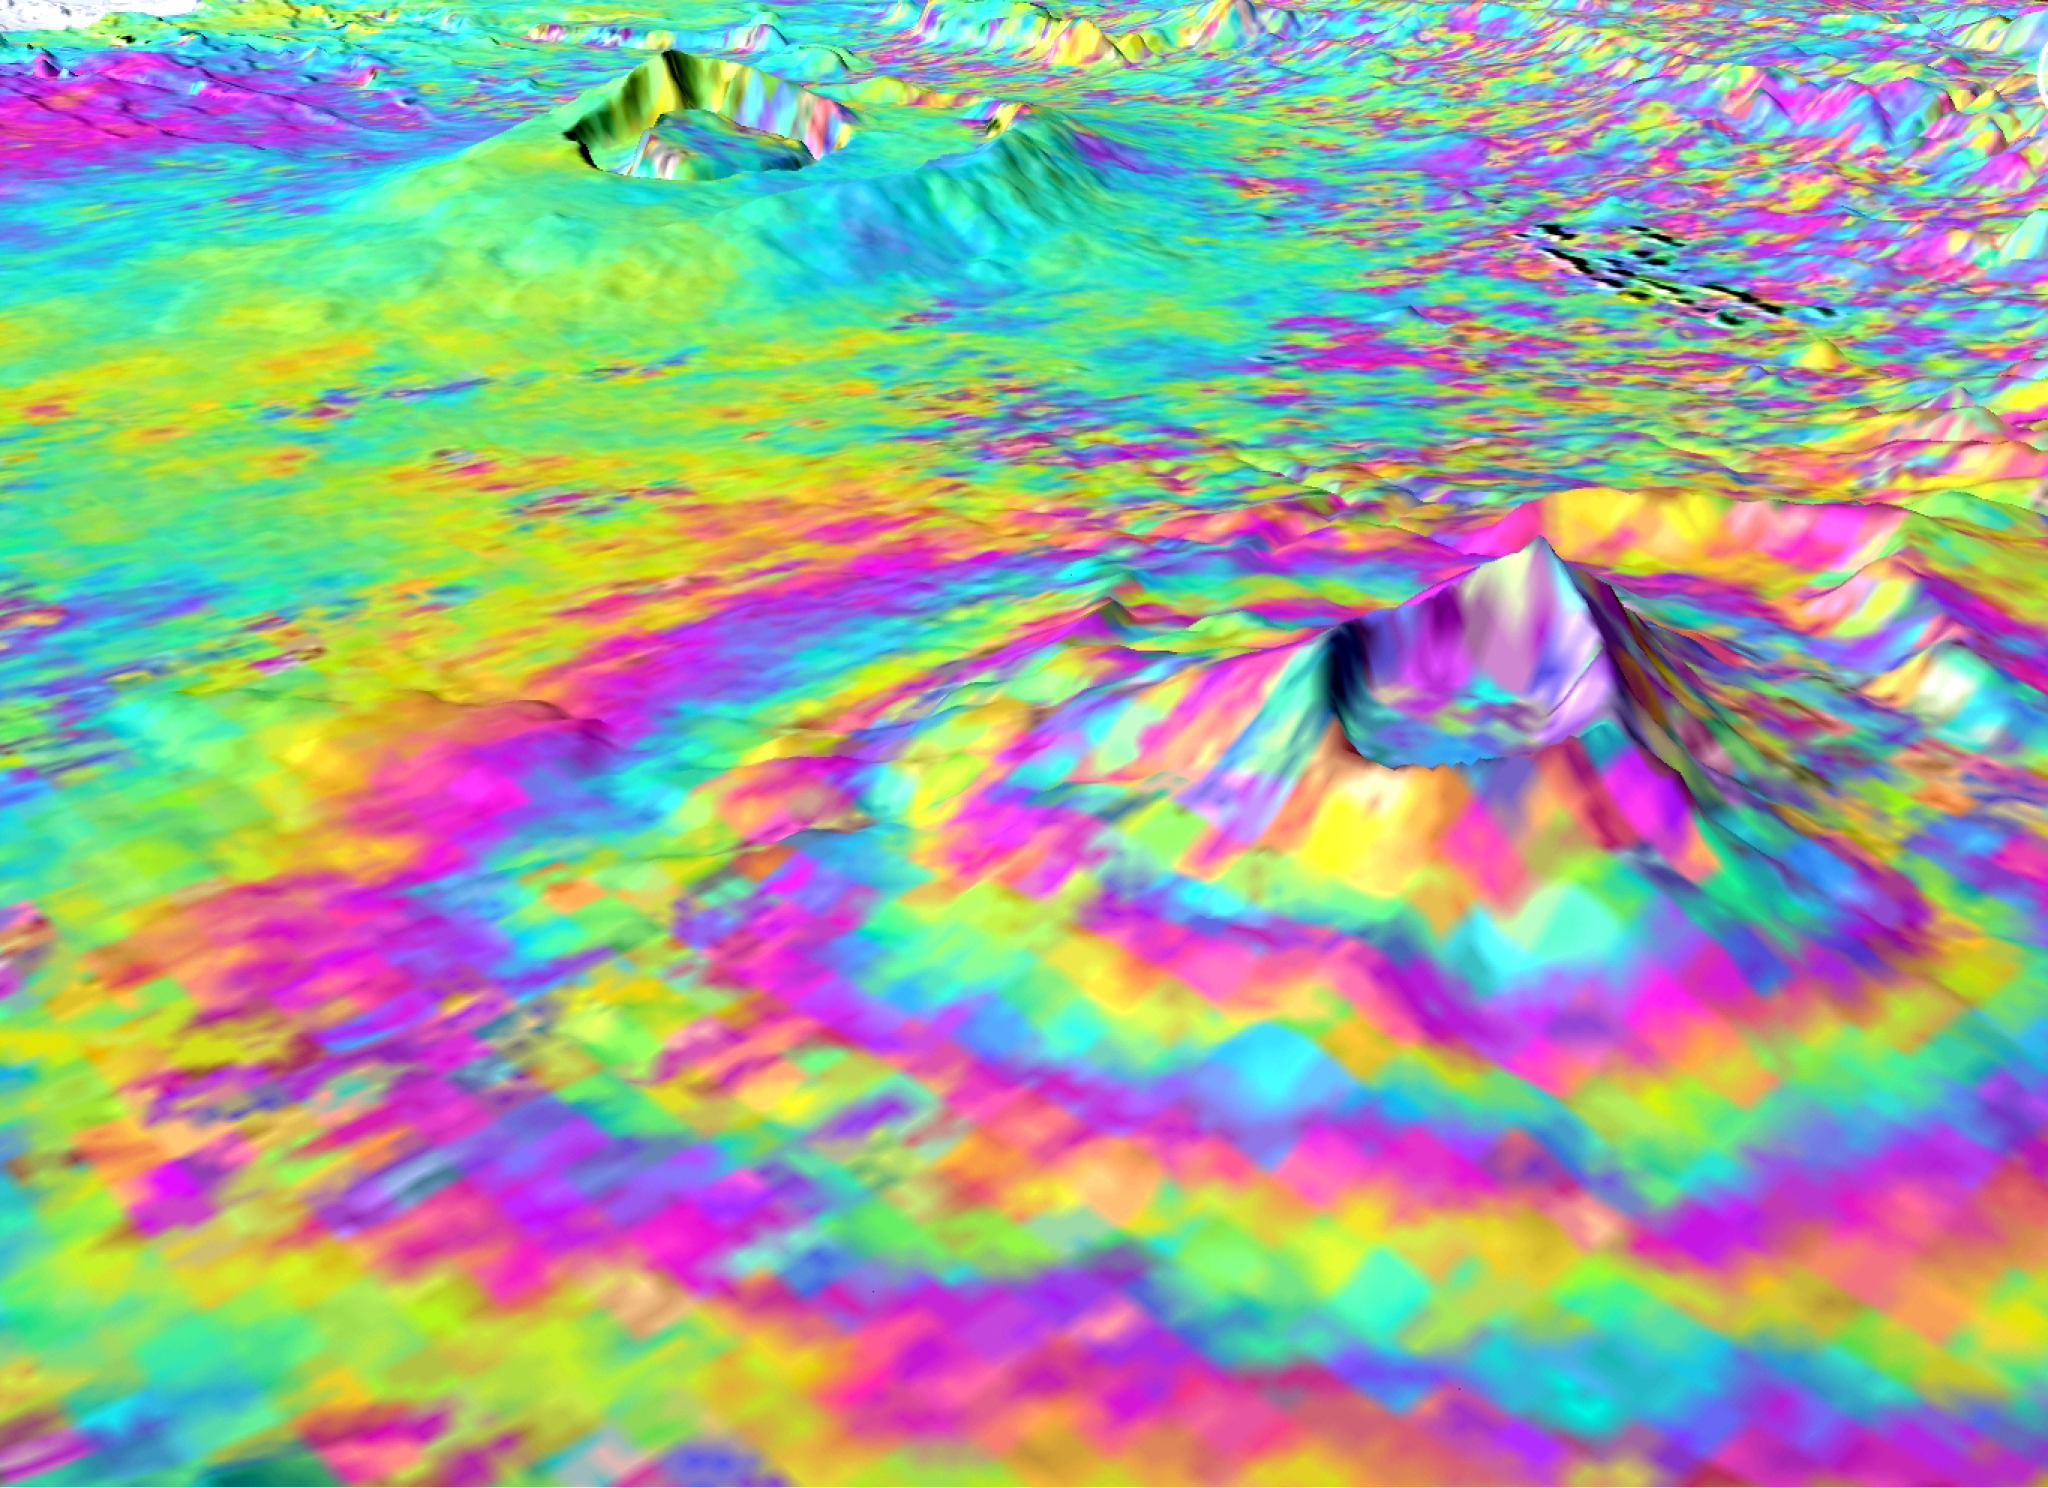
Comparing phase differences between corresponding pixels in image pairs yields a SAR interferogram in a process known as SAR interferometry (InSAR).
The interferogram---characterized by rainbow-colored interference patterns---is what is used to generate Digital Elevation Maps (DEMs) and monitor terrain changes.
 Envisat Advanced Synthetic Aperture Radar interferogram over the Kenyan section of the Great Rift Valley (Credit: ESA_Multimedia/Images/2010/06/Volcanic_uplift--CC BY-SA IGO 3.0)
The case for PSI: An overview of the DInSAR technique
Surface deformation caused by earthquakes, landslides, etc., introduces a phase difference to the interferogram.
We can measure such movements by subtracting the topographic phase (extracted from a reference DEM) from the interferogram. The result is a differential interferogram in a process known as differential interferometry (DInSAR).
While DInSAR is useful for monitoring surface changes over extensive areas with centimeter-level accuracy, it is unsuitable for areas that experience low deformation rates. E.g., infrastructure subsidence of several millimeters per year.
To get accurate deformation rates in low-rate deformation areas, it is essential to estimate and remove other phase components, such as atmospheric contributions. Unfortunately, because DInSAR involves the analysis of individual interferograms, it cannot accurately estimate the other phase components.
The Persistent Scatterer Interferometry (PSI) technique overcomes this limitation.
What is Persistent Scatterer Interferometry (PSI)?
PSI is a remote sensing technique that uses multiple SAR images acquired over the same area to measure and track slight changes on the Earth's surface. It is also known as Persistent Scatterer Interferometric Synthetic Aperture Radar (PSInSAR).
PSI employs appropriate data processing and analysis procedures to separate surface movements from other phase components.
It involves identifying pixels that have a strong and constant reflection over a long period: Persistent Scatterers (PSs). PSs have a high correlation and are therefore said to be coherent.
Coherence is a measure of the phase noise in the interferogram.
If corresponding pixels in image pairs are similar, correlation is high, and coherence is high. The converse is true. If corresponding pixels are not similar, the phase will vary significantly, and coherence will be low. Such an image is said to be de-correlated.
Usually, PSs are hard objects, such as buildings, bridges, and rocks. As such, PSI is ideal for predicting and preventing infrastructure damage related to deformation. Let us see how.
How to predict and prevent infrastructure damage using PSI
Several PSI deformation monitoring approaches have been proposed. In this section, we provide a general overview of the steps followed when using PSI to predict and prevent infrastructure damage.
Step #1: Collecting a atack of SAR images covering the area of interest
First is the identification and acquisition of radar images captured by a sensor or sensors with identical characteristics over a specific period.
Each radar sensor collects data in one specific microwave band. The bands, which cover different wavelengths or frequencies, are identified using letters, as shown below.
 Radar bands. TerraSAR-X operates at a 3.1 cm wavelength and falls in the highlighted band (Source)
Small details can be better recognized if a short wavelength is used. Thus X-band data---like 1 meter resolutionTerraSAR-X imagery---is often preferred for infrastructure monitoring as opposed to the C-band and L-band.
Nevertheless, it is important to note that the freely available Sentinel-1 C-band SAR data offers advantages in terms of costs and spatial coverage (250km swath width).
Common radar satellite missions are shown in the table below.
 Source: Pribicevic, Bosko & Đapo, Almin & Govorcin, Marin. (2017). The application of satellite technology in the study of geodynamic movements in the wider Zagreb area. Tehnicki Vjesnik. 24. 503-512. 10.17559/TV-20160817013320. Accessed via Research Gate
Multiple radar images covering the same area are required for PSI-based infrastructure monitoring to accurately estimate and remove topographic and atmospheric errors---separating them from the displacement component. For example, PSI analysis using C-band SAR imagery requires at least 15-20 images.
Additionally, the selected images should be such that the distance between any two acquisition spots perpendicular to the satellite viewing direction---known as the perpendicular baseline---is not more than the critical baseline value.
For Sentinel-1, the critical value is about 200 meters, and for ERS is 300-400 meters. Beyond the critical value, there is a high level of de-correlation, limiting the interpretation of the interferogram.
It is also important to note that the wavelength and temporal resolution of the radar band used determine whether deformation is measurable unambiguously. PSI interferometric phases are wrapped in 2π cycles. Hence, deformation between subsequent image acquisitions can only be measured unambiguously up to a differential phase difference of π---which corresponds to λ/4---over the revisit time. λ is the SAR wavelength.
Step #2: Co-registration and generation of SAR interferograms
Having identified a time series of suitable radar images, the next step is the generation of interferograms.
But first, the images have to be co-registered.
Co-registration is a fundamental step in interferogram generation. It compensates for, among others, orbit skewing, different sampling rates, and sensor attitudes between the two acquisitions.
We select one radar image as the reference or primary image. The other radar images, known as secondary images, are co-registered to the primary image. Co-registration ensures that each ground target contributes to the same (range, azimuth) pixel in both the primary and the secondary image.
Normally, the secondary image is re-sampled so that the final interferogram will be in the same (slant range, azimuth) reference of the primary image.
After co-registration, multiple interferograms are computed. The inputs are pairs of SAR images that cover the same area and a DEM to estimate and remove the topography from the final interferogram.
The phase of the generated interferograms in this step not only represents ground subsidence or uplift but also contains atmospheric, topographic, and other errors.
To accurately estimate deformation, we select a network of persistent scatterers.
Step #3: Selection of persistent scatterers
The selection of persistent scatterers involves the analysis of pixels whose response to the radar is dominated by a strong reflecting object and is constant over time.
PS selection is a two-stage process.
First, we identify a set of pixels that have large, consistently similar amplitudes in each interferogram. Identification is based on the amplitude dispersion index---a value that describes the amplitude stability. Pixels whose amplitude dispersion index is within the specified threshold are selected. These pixels are called persistent scatterer candidates (PSCs).
The goal of this first step is to reduce the amount of data analyzed in the next step, ensuring computational efficiency.
Second, the selected PSCs undergo further evaluation to select the final PSs. Evaluation can be carried out using different approaches. Some examples include:
-
Analyzing the amplitude of PSCs in the time series. Pixels whose amplitude is within predetermined thresholds are selected as PSs. This approach is called the amplitude dispersion method.
-
Comparing the amplitude at a PSC pixel with the surrounding pixels
-
Comparing the temporal coherence of PSCs in the interferograms
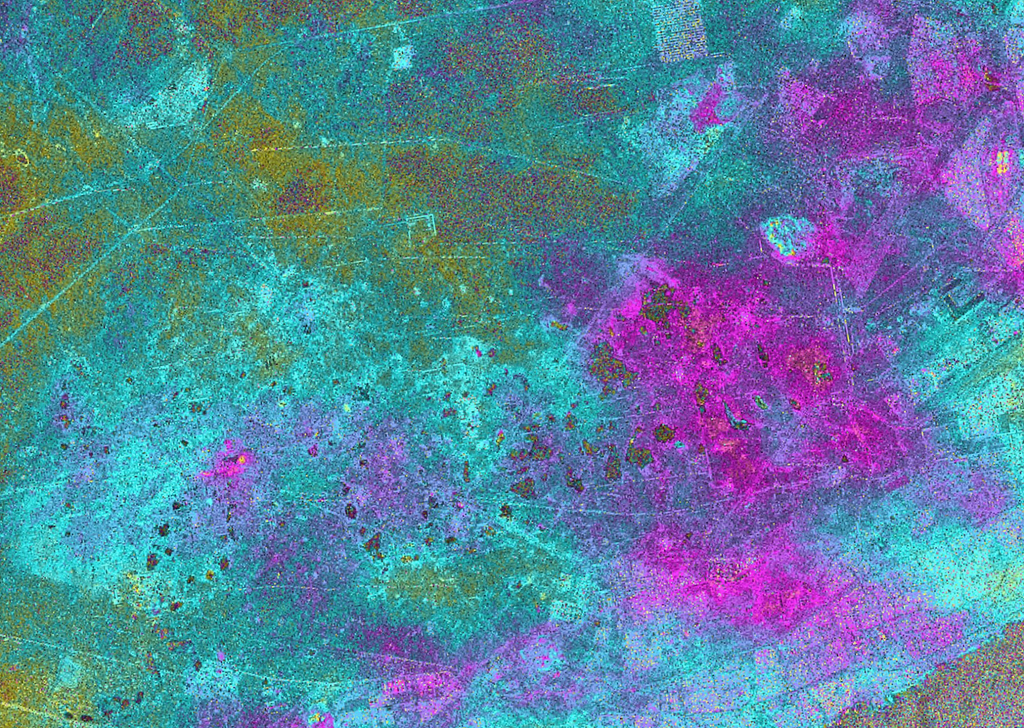
Areas characterized by physical change, e.g., vegetated areas, water bodies, shifting dunes, construction zones, or geometric distortions caused by steep terrain slopes, will inherently have fewer PSs. Higher numbers of PSs will occur on hard objects, such as buildings, rocks, bridges, and dykes.
Note: Corner reflectors can increase the number of persistent scatterers in an area. A corner reflector gives a strong radar return, which appears as intense bright spots on SAR images.
A corner reflector comprises two or three surfaces that are mounted at a 90 degrees angle to each other. Transmission towers and the smooth side of a building on a smooth ground surface are examples of natural corner reflectors.
Step #4: Phase unwrapping
Phase can only be measured in the range 0 to 2π. Before the radar signal arrives on the ground and then back to the sensor, there will be a lot of 2π cycles. Such a phase is said to be wrapped.
The interferometric phase is a value between 0 to 2π plus an unknown number of cycles. To get the real phase difference, we need to carry out an unwrapping calculation. It entails adding or subtracting multiples of 2π to the wrapped phase.
Step #5: Generation of deformation time series and estimation of deformation velocity
Once the phase is unwrapped, the phase values are converted into metric units. PS phase values are then expressed as absolute values in the Line-of Sight (LOS) direction by tying them to reference points. Reference points are stable points as measured by GPS, leveling equipment, or other terrestrial survey methods.
The outcome is a deformation time series and the deformation rate estimated over the analyzed PSs.
The deformation values are overlaid over critical infrastructure, e.g., roads, bridges, buildings, etc., to calculate deformation for each of these elements. Areas with high deformation rates or significant subsidence can then be identified and closely monitored to predict and prevent infrastructure damage.
 TerraSAR-X PSI derived deformation rates of selected PS points overlaid on infrastructure. Source: Lan, H., Li, L., Liu, H., & Yang, Z. (2012). Complex Urban Infrastructure Deformation Monitoring Using High Resolution PSI. IEEE Journal of Selected Topics in Applied Earth Observations and Remote Sensing, 5, 643-651.(Accessed via ResearchGate)
Limitations of the PSI technique
-
We can only measure the rate of deformation along the sensor's LOS, i.e., the line connecting the sensor to the object.
-
PSI only measures deformation over PSs. It is not suitable for areas that suffer from temporal de-correlation, e.g., vegetated areas or rapidly urbanizing areas. Such areas lack stable points or structures which can be used for measurement.
-
It is difficult to assign a PSs to an object or part of an object---unless a corner reflector is used---limiting its use in deformation analysis of a specific part of a structure.
-
As with any algorithm, PSI can be subject to human error, mainly when selected reference points which are assumed to be stable are unstable, introducing errors into the measurement.
Get Started
You have discovered the importance of SAR in predicting and preventing infrastructure damage and may be wondering how to get started. Start by testing TerraSAR-X sample datasets free of charge. Learn about the features and benefits of the sample datasets here.
Need additional data? You can order custom SAR data to fit your use case.
Whichever way you choose to get started, our team of geospatial data experts is ready to support you every step of the way.


