How SAR data is complementary to optical
Editor's note: This article was originally published on June 22nd, 2022. It was revised and updated by the UP42 team on June 18th, 2026.
Information retrieved by optical and synthetic aperture radar (SAR) sensors differ to a great extent.
On the one hand, optical sensors are passive, gathering information in the visible and near-infrared sections of the electromagnetic spectrum. And on the other hand, SAR sensors are active, collecting information in the microwave portion of the spectrum.
These differences, however, do not mean that their use is isolated.
There is a lot of complementarity between the two—meaning that SAR data can benefit from optical imagery and optical imagery can benefit from SAR data.
Here, we'll take a closer look at that interplay and see what drives it. Let us jump in.
What is Synthetic Aperture Radar (SAR) data?
SAR data is captured by a radar sensor mounted on a moving platform (satellite or aircraft). The sensor transmits microwaves to the Earth's surface and records the backscattered signals. The signal delay is used to determine the distance (range) between the sensor and the surface objects.
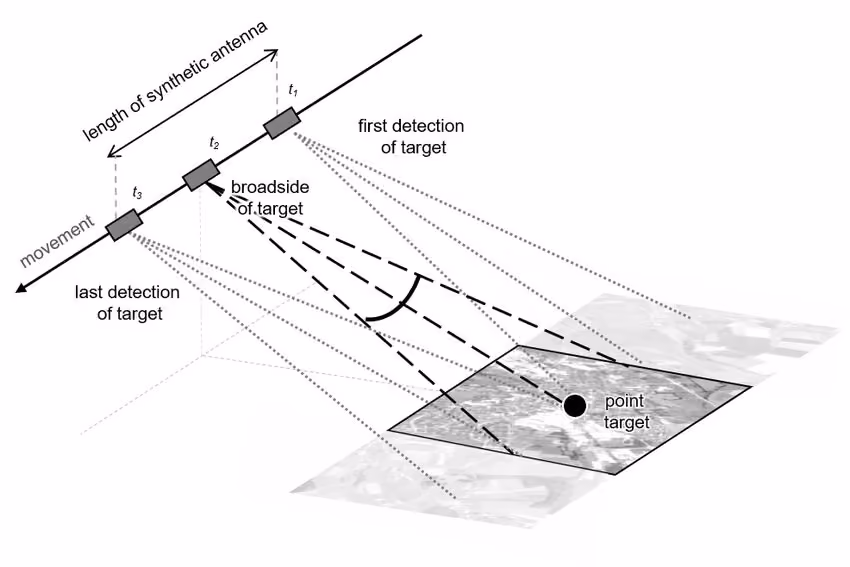
Why is it called "synthetic aperture"?
The forward motion of the platform enables the transmission and reception of signals to the same object from successive sensor positions. Combining the backscattered signals from the object enables the construction of a synthetic aperture. The synthetic aperture is equal to the length of the orbit where the object is detected.
Why is it necessary to synthesize a virtual aperture?
To achieve a higher spatial resolution. The longer the SAR antenna length, the higher the spatial resolution, and vice versa—holding the radar wavelength constant. But, there is a limit to the physical length of an antenna that can be mounted on a platform.
Shortening the wavelength is not a viable option as it reduces the cloud penetration capabilities of the radar signal. Thus, it becomes necessary to synthesize a longer antenna using a synthetic aperture.
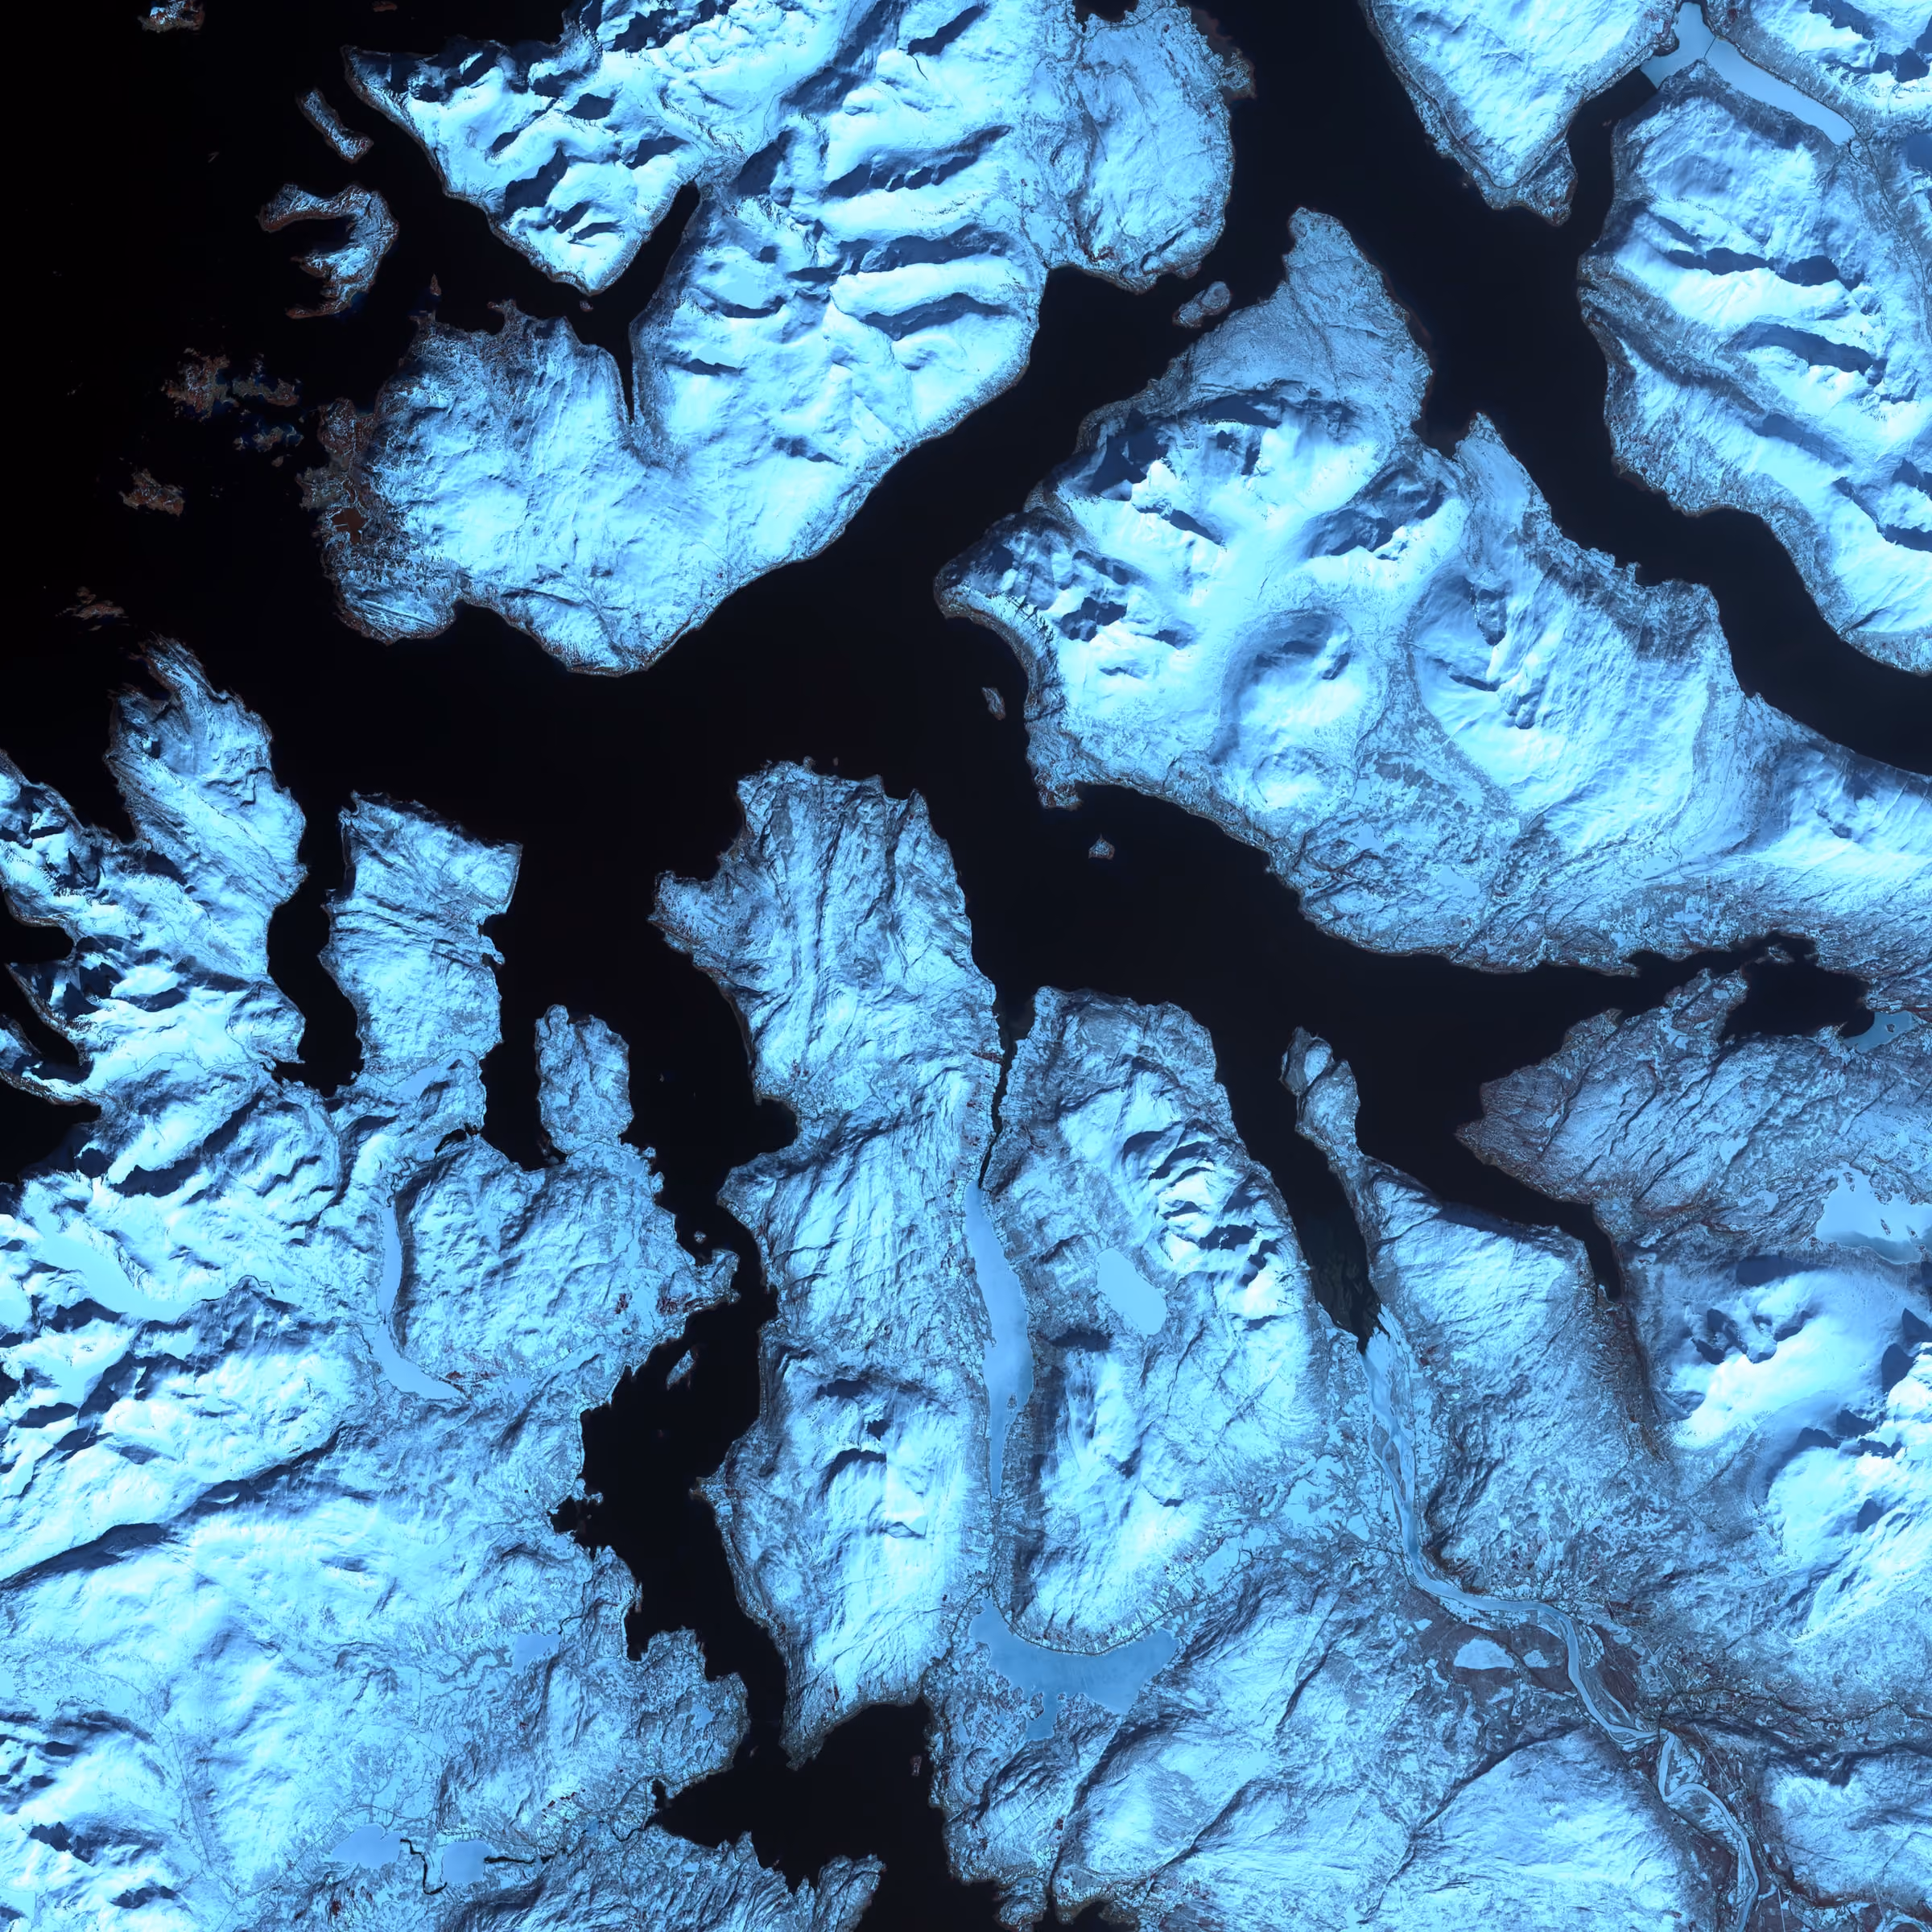
What information is recorded by SAR imagery?
SAR imagery captures the phase and amplitude (or intensity) of backscattered signals. These depend on:
- SAR sensor properties like wavelength, polarization, viewing geometry, and transmitted power
- Interaction between the microwave signal and the imaged surface, which is influenced by surface roughness, shape, terrain, humidity, etc.
Which are the commonly used SAR frequency bands?
The table below shows the frequently used radar frequency bands, the corresponding wavelengths, and examples of applications.
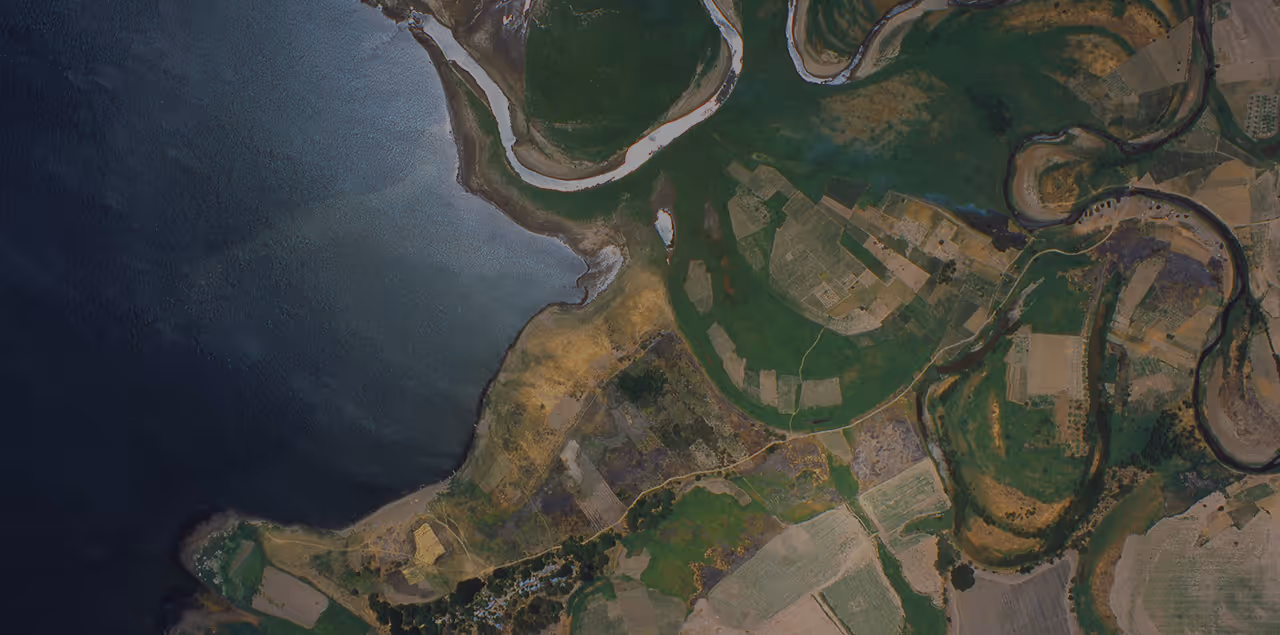
What is optical remote sensing data?
Optical data is imagery collected by sensors which do not emit their own radiation but measure solar radiation reflected into the atmosphere by objects on the Earth's surface. Such sensors, which depend on an external source of energy to collect data, are called passive sensors.
What information is captured by optical imagery?
Optical imagery records radiance: the amount of radiation reflected by a surface. We also refer to this as reflectance or brightness. Reflectance varies by the characteristics of the imaged surface, recorded wavelengths, and atmospheric conditions.
Which are the commonly used optical remote sensing frequency bands?
Optical remote sensing systems measure light in the visible and infrared bands of the spectrum. The wavelengths range from ~400 nm (blue) to ~2500 nm (shortwave infrared).
Images collected in the visible part (red (R), green (G), and blue (B) bands) of the spectrum can be combined to create RGB imagery which resembles how the human eye perceives the environment.
Infrared bands are not visible to the human eye but are important for revealing "unseen" properties like vegetation health, species characteristics, and surface composition.
Depending on the number of spectral bands detected by the sensor, optical imagery can either be panchromatic, multispectral, or hyperspectral. Multispectral and hyperspectral sensors collect data over many wavelength bands. Panchromatic sensors collect data in a single band by combining information from the visible RGB bands.
Check out this post for a comprehensive rundown on satellite imagery, including factors to consider before purchase.
What is the difference between satellite optical imagery and aerial optical imagery?
First, satellite imagery is captured by spaceborne sensors mounted on satellites, while aerial imagery is captured by sensors aboard an aircraft or drone. Second, satellite imagery captures extensive areas in one pass, whereas aerial imagery captures smaller areas at a go. Last, the spatial resolution of aerial optical imagery may be higher than that provided by satellite optical imagery.
Nevertheless, some satellites capture very high resolution optical imagery. For example, Pléiades Neo provides imagery with up to 30cm spatial resolution.
Find out how satellites, drones and helicopters complement each other in vegetation management.
What does optical imagery gain from SAR?
So what does optical geospatial imagery stand to gain from SAR? Well, a lot of it boils down to SAR being an active sensor. Geospatial optical imagery is limited at night when there is no light source, and by cloudy weather.
By emitting radiation, SAR sensors can collect data regardless of the weather or time of day. Also, signal characteristics like wavelength, polarization, and incidence angle can be adjusted according to the use case.
Let us explore specific ways that SAR complements optical data.
All-weather, all time acquisition capability
Approximately 67% of the Earth's surface is covered by clouds. As a result, optical data is characterized by clouds, which may reduce image quality.
Microwaves have longer wavelengths and can see through clouds, haze, dust, and other atmospheric conditions. Pairing SAR and optical imagery is therefore vital in areas which experience persistent cloud cover. Further, being an active sensor, SAR can collect data both day and night.
In this way, data combination increases the reliability of earth observation data for time sensitive tasks like wildfire monitoring or disaster response during emergencies.
Note: Although SAR is deemed an all-weather remote sensing method, heavy rainfall containing large water droplets may scatter microwave signals, introducing noise in the resulting image. Hence, it is important to establish whether it was raining at the time of SAR data collection before use.
Determination of object roughness and moisture content
Microwaves are sensitive to the roughness and dielectric characteristics of the target object. SAR data thus enables the extraction of additional surface properties beyond those possible with optical data only.
Let us see how.
Surface roughness refers to small height variations whose size is comparable to the radar wavelength, i.e., centimeters. Roughness or texture influences the strength of the backscattered signal.
Smooth surfaces like water or roads reflect most of the incoming radiation away from the sensor, resulting in regions of little or no signals. Such areas appear black in SAR imagery. In contrast, rough surfaces reflect most of the radiation to the sensor, resulting in bright image pixels. In this way, SAR enables the determination of surface roughness.
Microwaves are sensitive to moisture. Water increases the amount of energy stored in an object when it is subjected to an electric field. This ability to store energy is quantified using the dielectric constant, which increases with increasing moisture content.
Radar waves penetrate deeper into objects with a low dielectric constant, and vice versa. Objects with a high dielectric constant reflect most of the microwaves, resulting in a strong radar return.
Thus, if other factors—like surface roughness and wavelength—are constant, a difference in the intensities of returned signals could indicate a difference in the dielectric constant. For soils, this could show a difference in the soil moisture content. Radar penetration is highest in dry soils, e.g., desert soils, and low in moisture-rich soils, e.g., agricultural fields.
In a nutshell, pairing SAR images with optical data enables determination of the physical composition of the imaged surface. In addition, different SAR polarization combinations can reveal different object characteristics.
Note: Frozen soil has a very low dielectric constant, and may thus be interpreted as dry soil, which is not the case. SAR is therefore not an effective tool for soil moisture estimation in frozen areas.
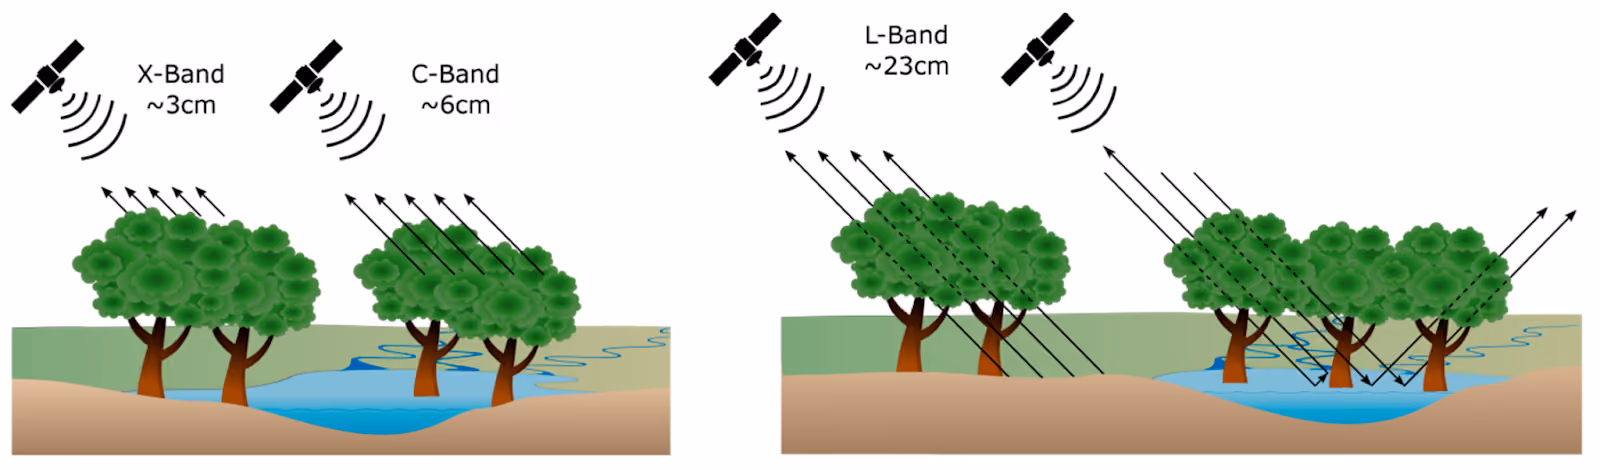
Vegetation penetration
Optical imagery captures the top of the vegetation canopies, enabling computation of physical variables like the leaf area index and the fraction of the vegetation cover. But the imagery does not show the vegetation structure below the canopy, like the shape and size of leaves, stems, etc.
Radar penetrates crop canopies and captures the variation in vegetation structure between different crop types or the same crops at various growth stages.
Vegetation penetration mostly depends on the radar signal wavelength. Longer wavelengths penetrate deeper than shorter ones. For instance, the L-band penetrates deeper into the canopy than the X-band, and may thus be useful in estimation of soil moisture below vegetation.
What does SAR gain from optical?
Spectral characteristics
SAR imagery lacks data on the visible and infrared ranges of the electromagnetic spectrum. Luckily, combining SAR with optical imagery fills this gap.
Optical sensors measure reflected solar radiation in specific intervals of the electromagnetic spectrum known as spectral bands. Materials on the Earth's surface respond differently in various spectral bands. For instance, vegetation strongly absorbs the red band and reflects near-infrared wavelengths, while water is sensitive to the short to mid-infrared bands. Spectral bands, therefore, can be chosen based on what you wish to examine.
Further, we can combine optical spectral bands to derive spectral indices which provide quantitative estimates of selected surface covers. An example is the Normalized Difference Vegetation Index (NDVI) and the Normalized Difference Water Index (NDWI).
In short, combining SAR and optical imagery facilitates identification and study of different materials found on the Earth's surface.
Data interpretation and processing
SAR sensors have a side-looking imaging geometry, making the resulting imagery susceptible to several distortions, namely:
- Scale distortions: Because the images are not collected at nadir but in a slanted position, objects suffer varying scale distortions depending on the distance from the sensor. SAR images, therefore, have to be transformed to ground distances for interpretation.
- Relief distortions: These are caused by human-made or natural terrain features. Relied distortions may either be:
- Foreshortening where the length of slopes facing the sensor appear shorter than those facing away.
- Layover where skyscrapers, mountains, and other tall features appear upside down. This is because the radar signal reaches the top first, making it appear to be in closer range.
- Shadows or areas of no data for slope sides facing the opposite direction from the radar sensor.
- Radiometric distortions: SAR compresses backscattered signals from different objects into fewer pixels. Apart from making slopes facing the sensor appear bright, the signal combination leads to speckle—grainy salt and pepper effects on the image—which degrades image quality and reduces image interpretability.
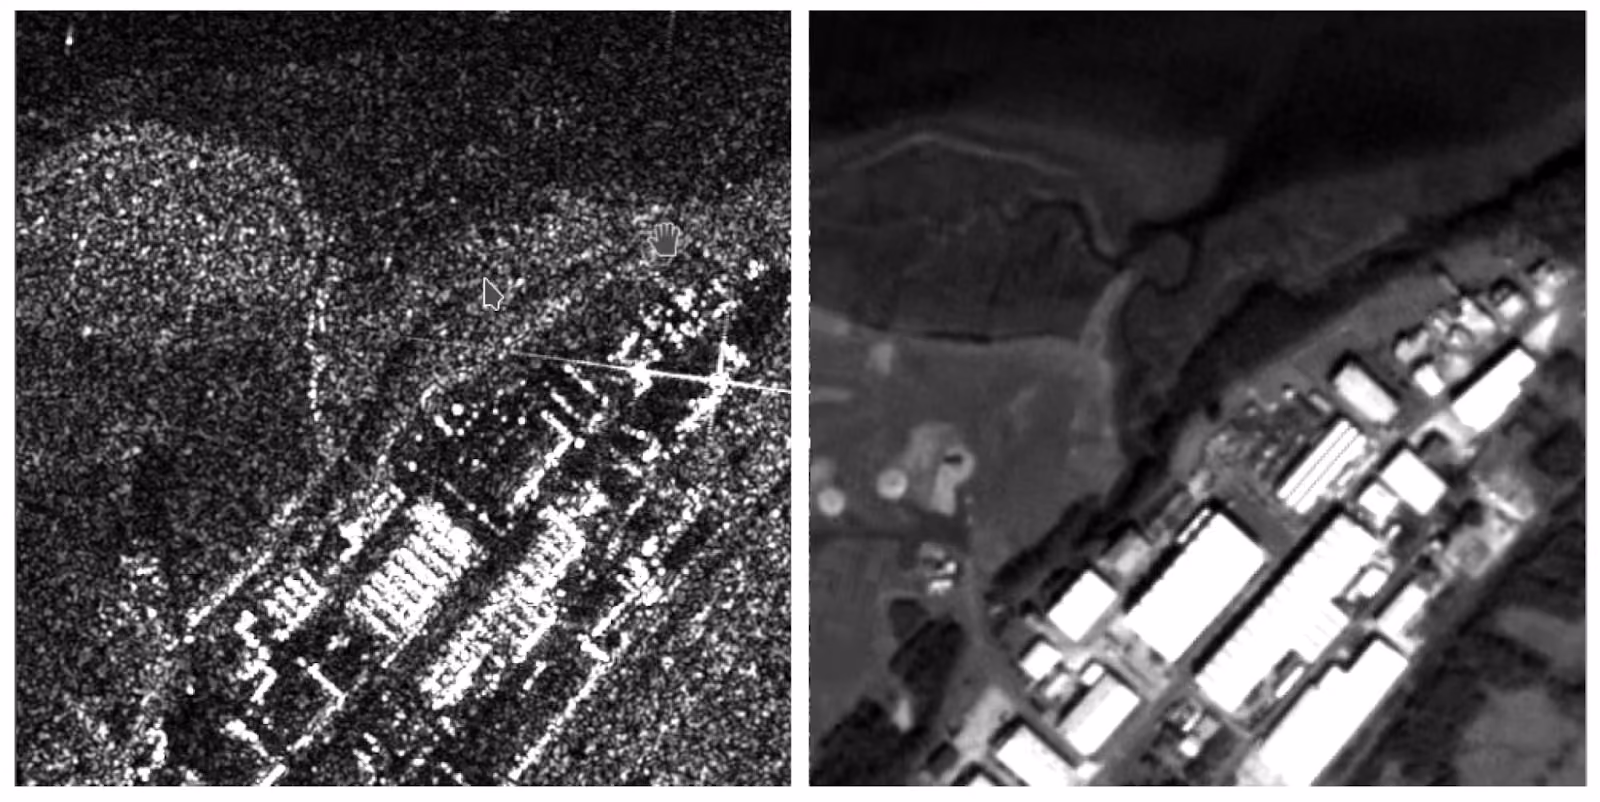
Consequently, looking at raw SAR data does not give useful information on the scene. To make it worse, SAR images are represented as black and white. But after processing, you can extract a lot of useful information from SAR.
Optical images are simpler to interpret because they capture images in the same way we see them. Pairing optical imagery with SAR data, therefore, facilitates the visual interpretation of SAR images.
SAR and optical: different, but highly complementary
While it may look like SAR and optical data at opposing ends of the earth observation spectrum, they can undoubtedly work together to benefit your application.
SAR signals interact in different ways with objects, providing information that optical sensors may not detect. For example, material composition and texture characteristics of target materials. In addition, SAR is independent of weather and illumination source.
But SAR is prone to distortions caused by its side-looking geometry, making it harder to interpret.
Optical data presented as natural color images are easier to interpret. They also contain spectral information, which is useful for characterizing different objects. However, they are unusable in the presence of cloud cover or without an illumination source.
For these reasons, you can extract a lot of value from combining SAR and optical imagery. What we have discussed here barely scratches the surface of what is achievable. Explore our rich archive of SAR and optical geospatial imagery and pair the datasets in your own way. We can't wait to see what you discover.
Key takeaways
- Unlike optical sensors, which need sunlight and clear skies, SAR sensors emits their own microwave signals and collect the returns. This allows them to "see" through clouds and smoke, as well as at night time.
- Optical imagery captures the spectral reflectance of the Earth's surface. SAR measures physical properties such as surface roughness, shape, and moisture content based on how its emmitted waves bounce back.
- SAR is good at detecting surface textures, from smooth to rough, and even including the moisture content of soil.
- With INSAR (Interferometric SAR), sensors can measure minimal changes in ground elevation over time. For monitoring land subsidence, volcanic activity, and the structural stability of infrastructure like bridges, this makes SAR extremely important, as these tasks are impossible with standard optical imagery.
Subscribe to our newsletter
Stay up to date and learn about our fast-growing new features