How to create a 3D visualization with elevation data from UP42
Elevation data might sound complicated at first, but it's enormously useful and worth getting familiar with. These datasets take the form of raster images, where every pixel contains an elevation value, and are collectively referred to as Digital Elevation Models (DEMs). UP42 offers a wide variety of different DEM products from providers including Airbus, Nextmap, Planet, and Vexcel.
Within the broad category of DEMs, there are two common sub-types. The first is a Digital Surface Model (DSM), where the data contains the elevation not just of the underlying land, but also all of the non-geographical features that appear on that land—think things like trees, structures, and other elements of the built environment. Often this data is created through the use of stereo photogrammetry, where multiple images are taken of the same location in quick succession, but from different angles, and then a 3D image is built from these images.
The second major category of elevation products that UP42 offers are Digital Terrain Models (DTMs). A DTM is similar to a DSM. However in this case, only the geographical features are included in the data, and everything that lies atop the landscape has been omitted. DTM creation is generally a more involved task, and requires the use of specialised algorithms and significant manual work to smooth out non-geographical features.
Setting Up BlenderGIS
While DEM data can be worked with as a 2D raster image in a program like QGIS, to truly get the full picture of this data, we can transform it into a 3D model. For this, the free and open source 3D computer graphics software Blender is an immensely powerful tool, enabling a user to quickly create beautiful representations of DEM data. Once it has been installed, it is also necessary to also install the BlenderGIS package. To do this:
- Go to the Github repository for BlenderGIS, and download the package as a .zip file, using the dropdown menu under 'Code'.
- Open Blender, and navigate to Edit > Settings, and then choose 'Add-ons' from the menu on the left-hand side. Click the drop-down menu in the top right corner of the box, and select 'Install from Disk'. From there, install the 'BlenderGIS-master.zip' file, accepting the default configurations.
Selecting your data
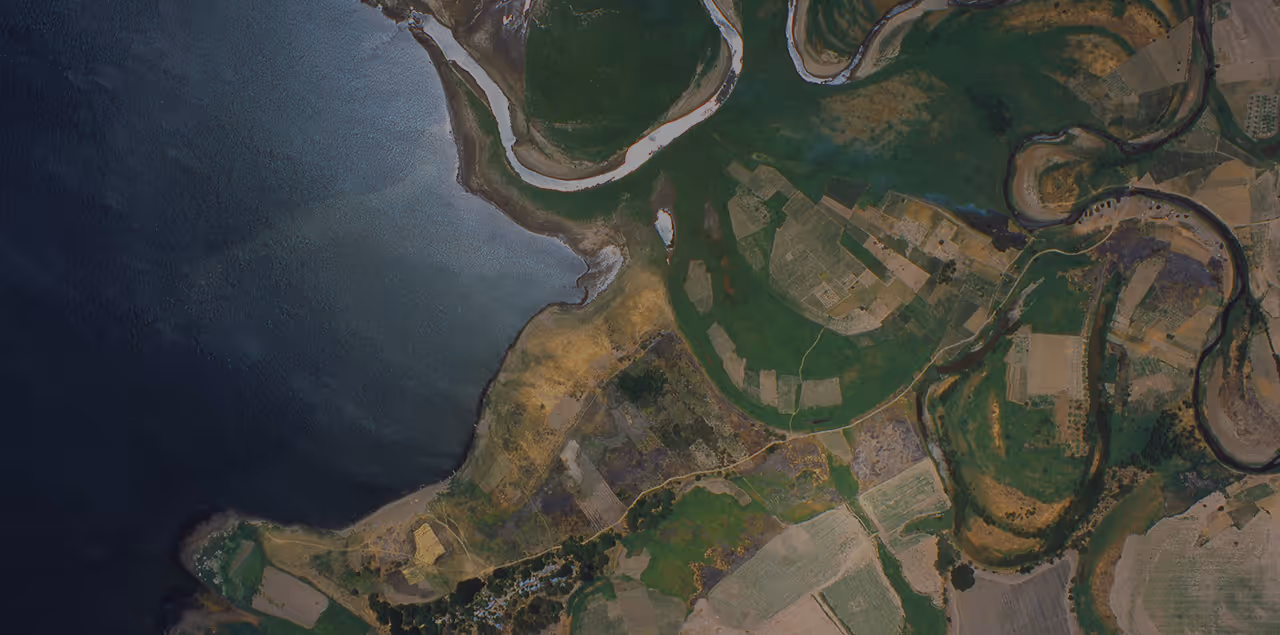
In order to make a 3D visualisation, you will first of course need a DEM dataset. As mentioned, DEM data can be purchased from UP42, from a number of different providers, but if you want to try before you buy, we also make available a range of different sample datasets. A good dataset for this use case is the WorldDEM Neo DSM product, a medium resolution 5m Digital Surface Model, acquired worldwide between 2017 to 2021. This tutorial will make use of one of the samples available on the UP42 Console of this dataset focussing on an AOI in the Katmai National Park in Alaska. In addition to the DEM, in order to improve the visualisation, it also helps to have an RGB image of the same location. While UP42 of course offers a large number of different optical sensors which global coverage, for this example, a free Sentinel-2 image will be used of the same location. Critically, new versions of the DEM and RGB .tif files should be created with the exact same bounds, and CRS as each other.
Creating the 3D model
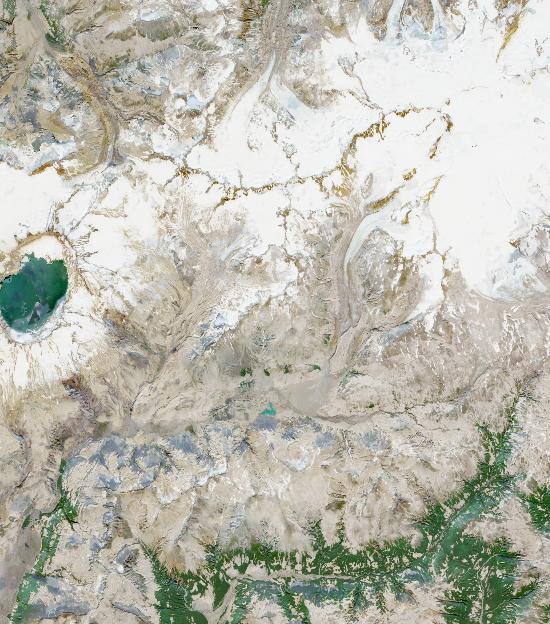
With the data obtained, it is now possible to create a 3D model in Blender. For the first step, you will need to navigate to GIS>Import>Georeferenced raster and then import the RGB .tif image, using default settings.
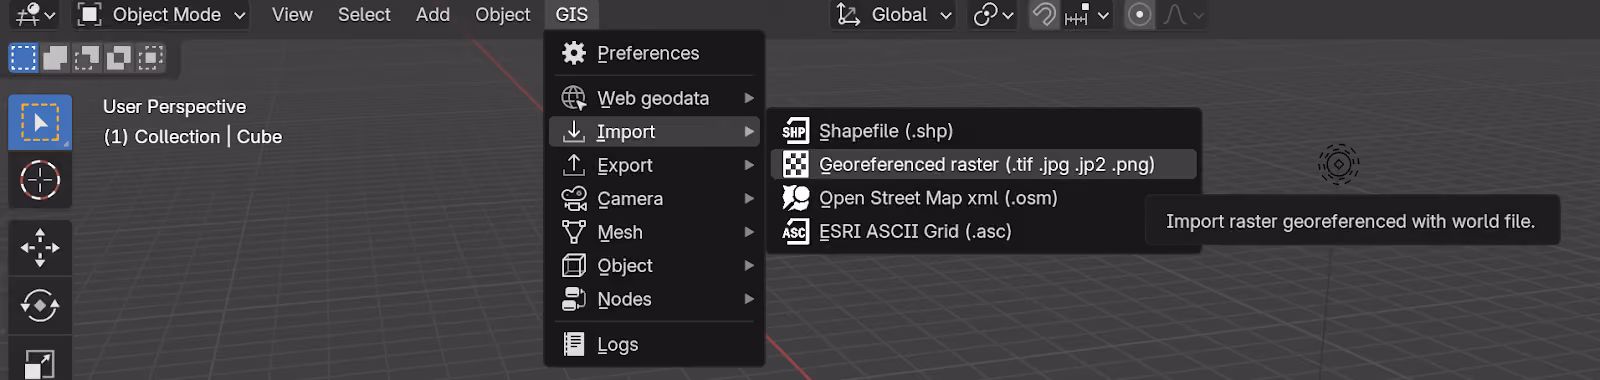
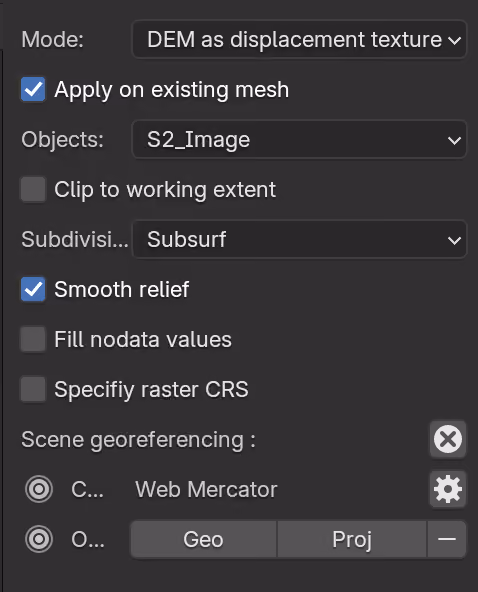
Now, with your RGB data added, it is time to add in some topography! To achieve this, once again navigate to GIS>Import>Georeferenced raster, and import the DEM .tif file. However rather than use the default import options, under 'Mode' select 'DEM as displacement texture', as well as 'Apply on existing mesh', and select the RGB image on the drop-down menu under 'Objects'.
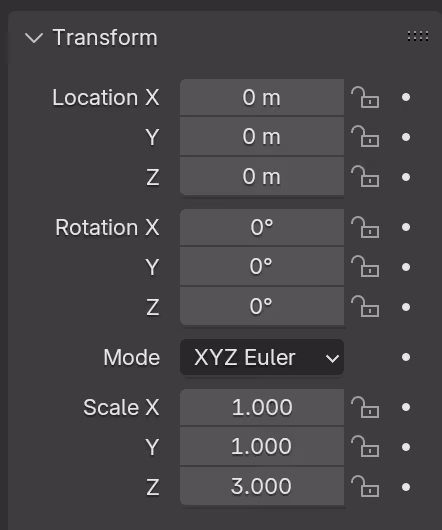
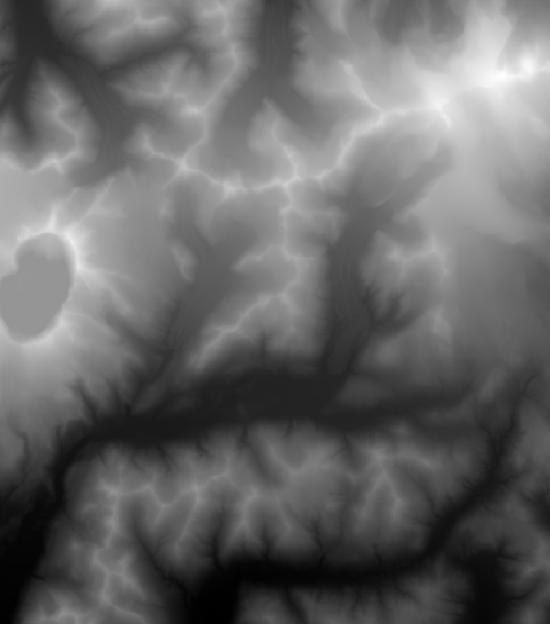
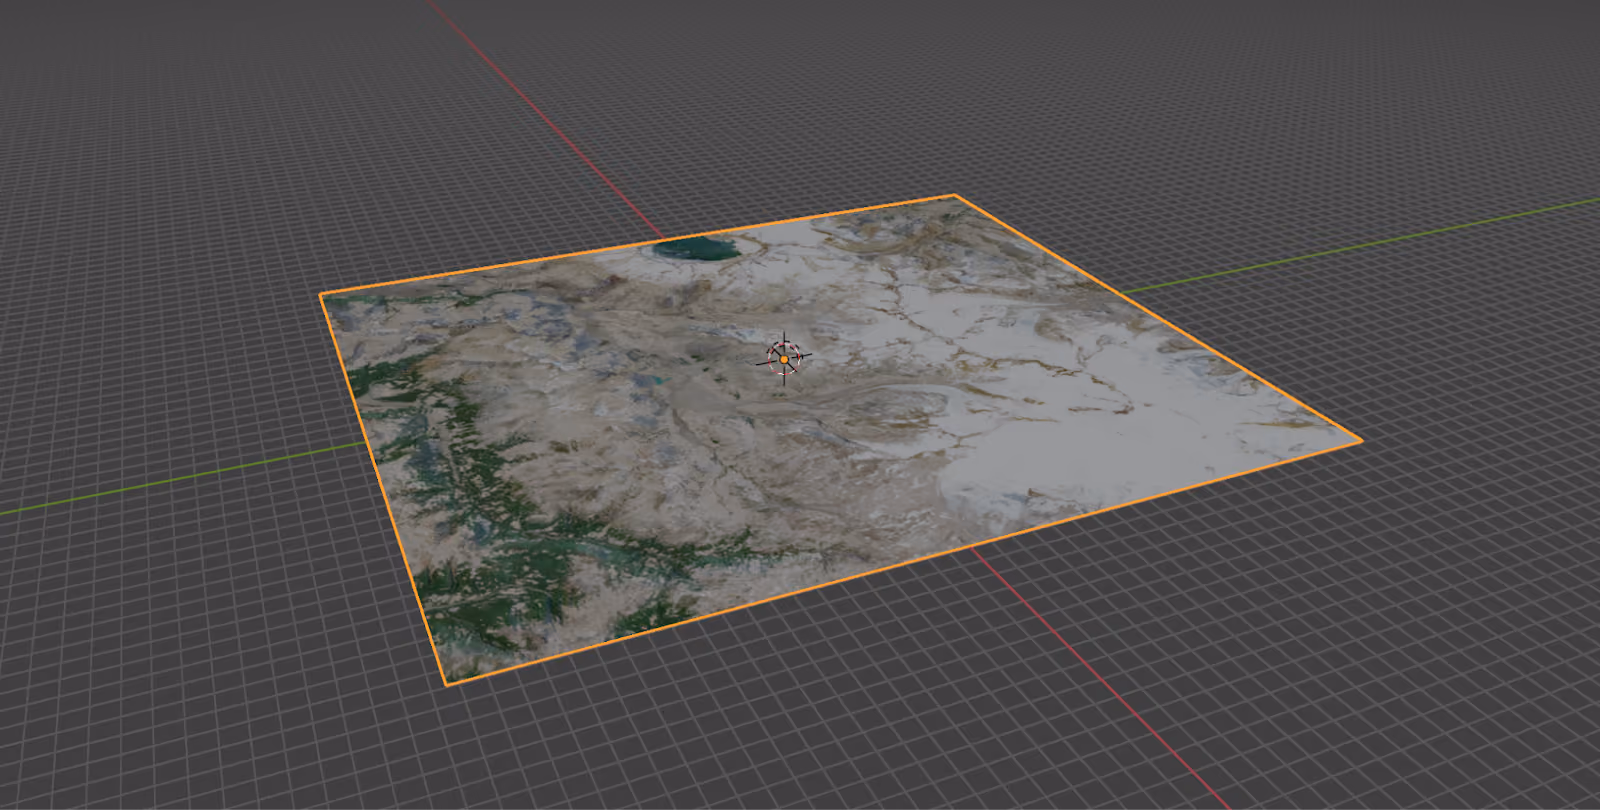
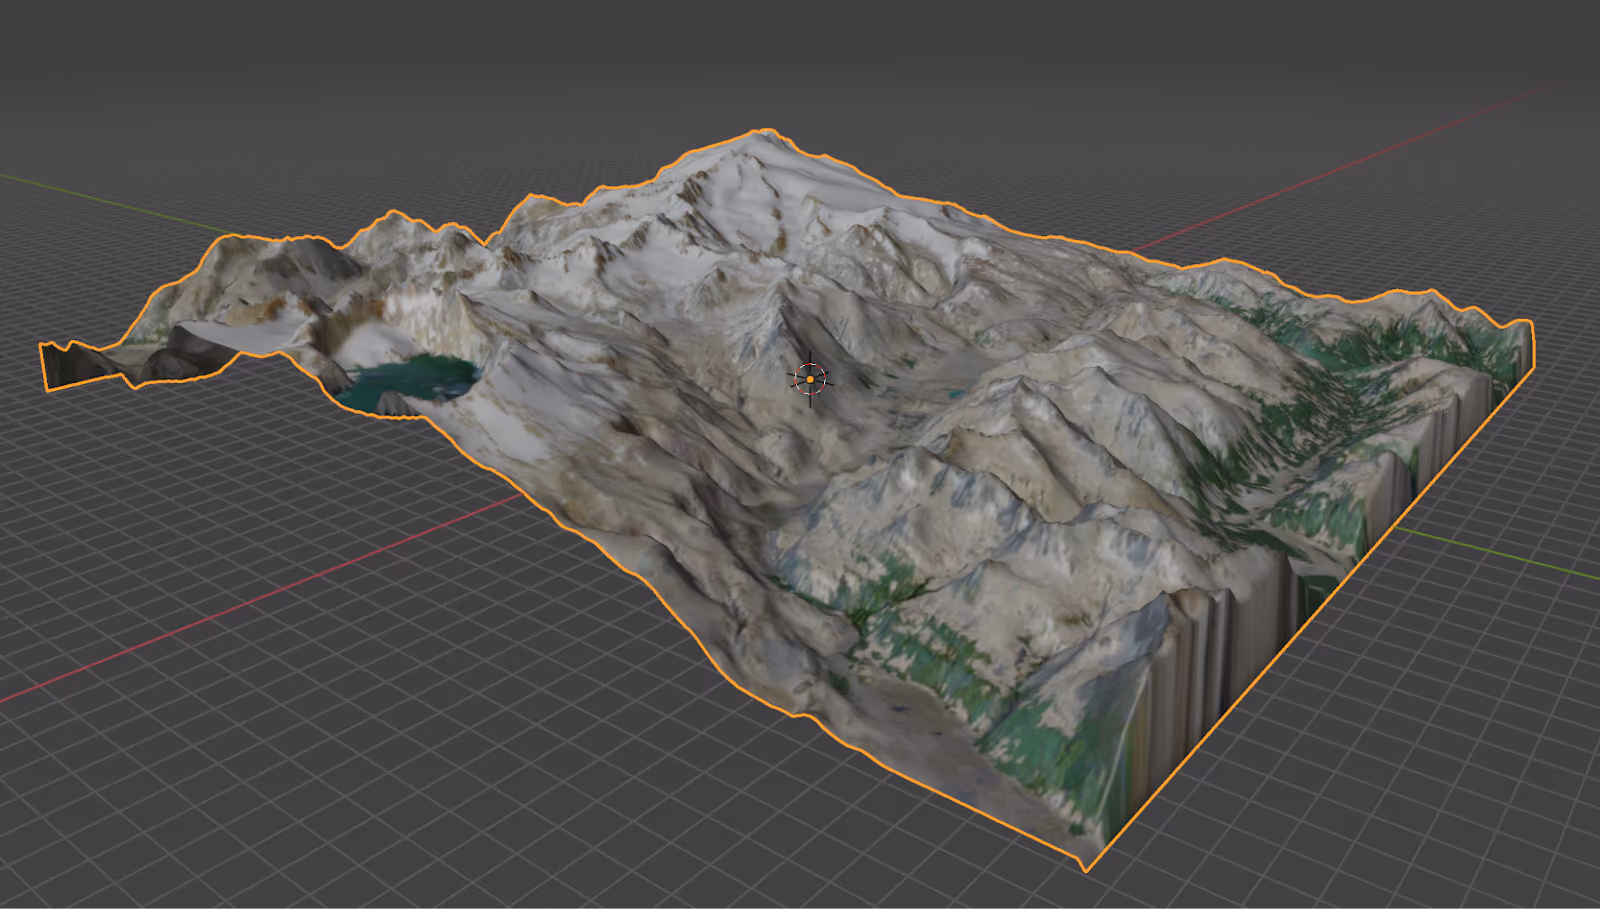
Once the DEM has been applied to the mesh, the vertical scale can be exaggerated by changing the value of Z under Transform>Scale to a value higher than 1 (for example 3). In addition, the resolution of the mesh can be improved by applying a 'Subdivision Surface' modifier, set to 'Simple' and a Levels Viewer of 2. This will result in a visualisation of the landform as seen below.
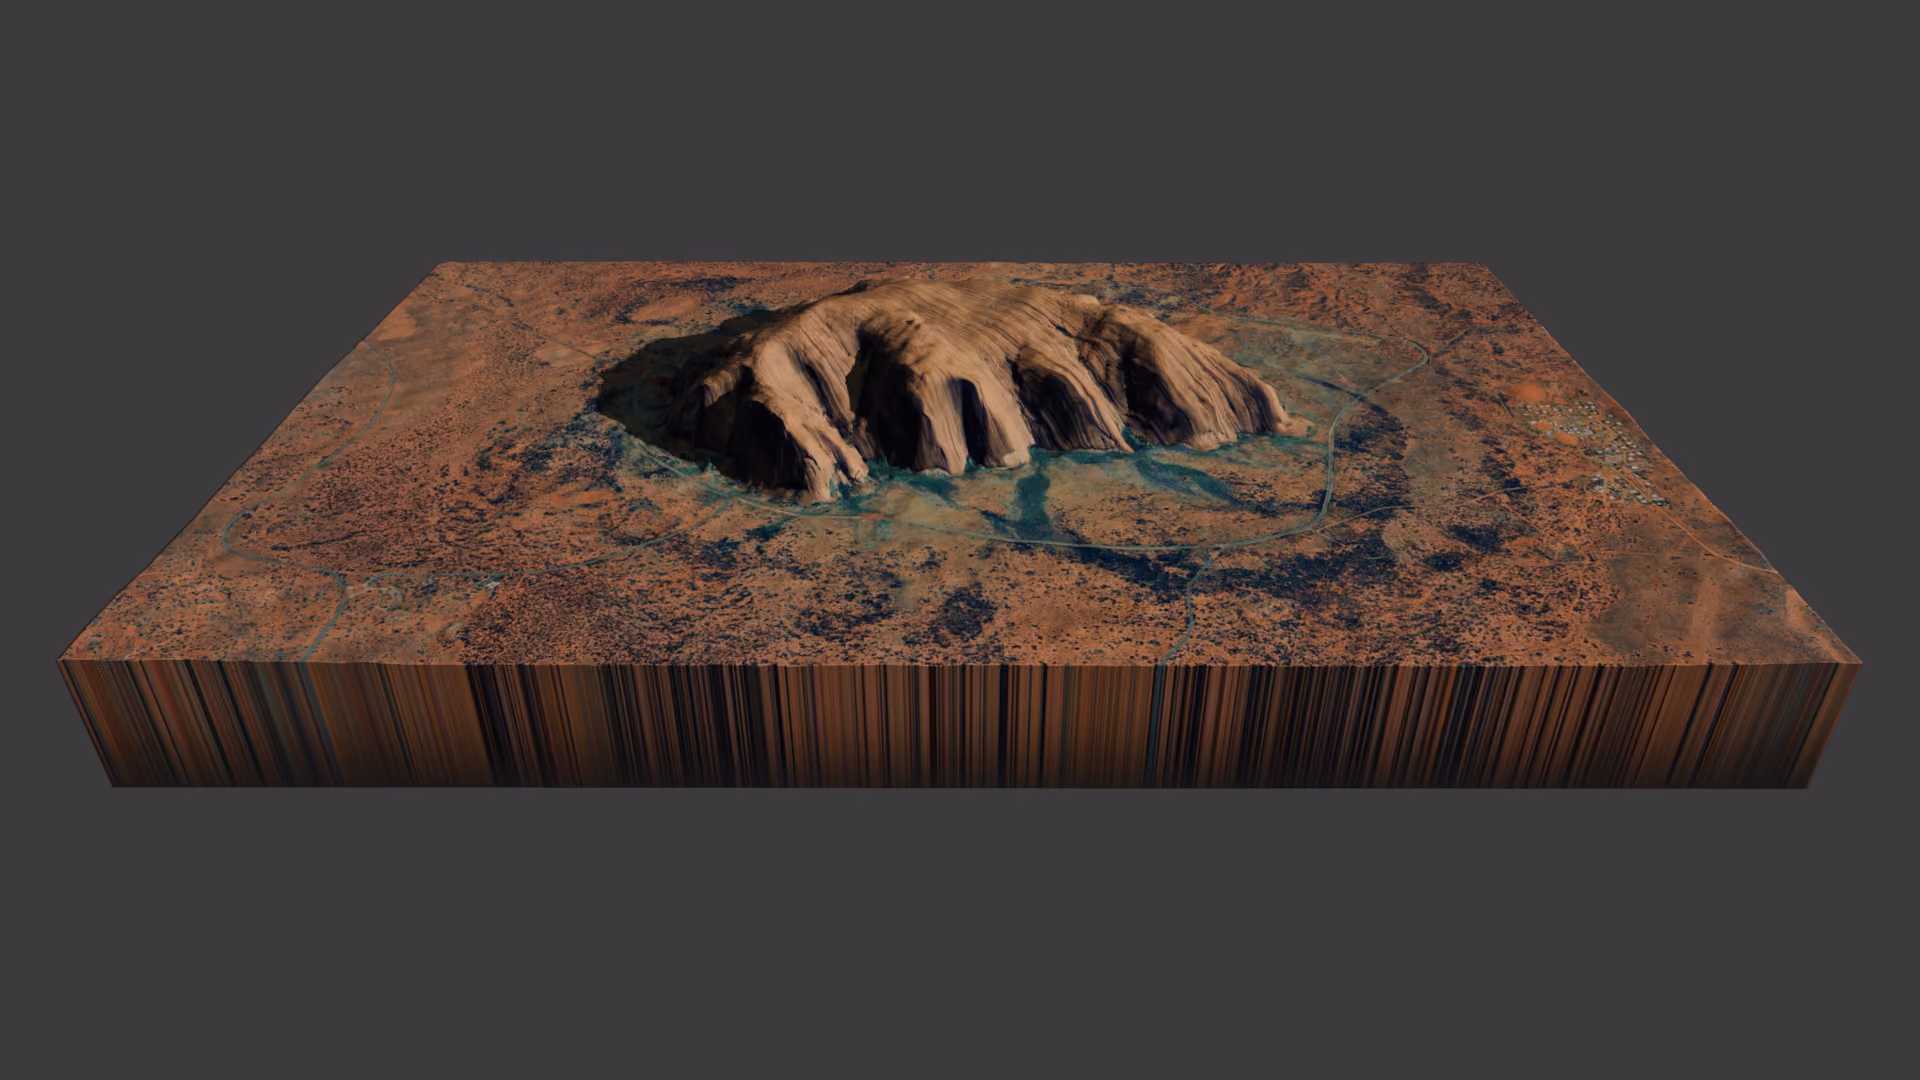
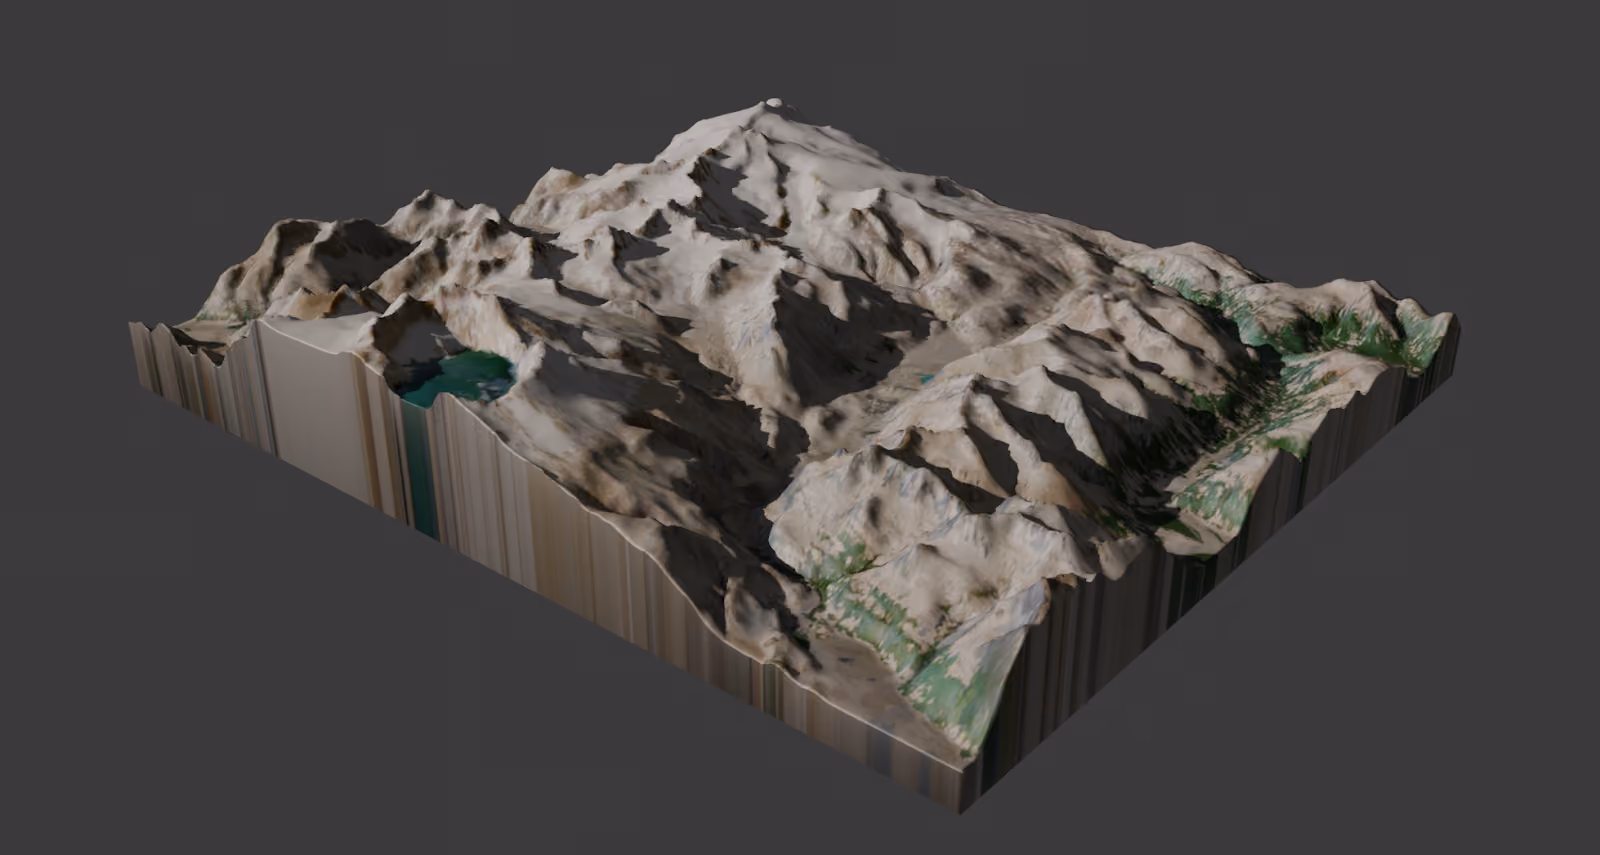
Finally, the image can be further aesthetically improved by adding features such as an extruded base (achieved by extruding the mesh down and then hitting 'S+Z+0'), and dynamic lighting in the form of a Sun object. The final result will look like the image below:
Want to try it out yourself? Sign up for the UP42 platform to get started.

Subscribe to our newsletter
Stay up to date and learn about our fast-growing new features