How to improve utility vegetation management with satellite imagery

If a single utility goes down in an urban area, it's likely to cause millions or even billions of dollars' worth of losses and damage. And vegetation is one of the most common causes of utility outages, impacting power lines, railroads, clean drinking water, and more. So governments and providers have a clear and vested interest in managing vegetation around their utilities.
But if that's the case, then it's worth looking into where we can improve. All too often, processes involve manually inspecting thousands of miles of infrastructure and preventative maintenance that's little more than guesswork. That leaves reactive maintenance as the main problem-solving method, but by then, customers are already in trouble.
Utility operators are aware of this, of course: in 2021, the global vegetation management market size was 22.87 billion USD. That number is expected to grow to 39.27 billion in 2021, according to an analysis from Fortune Business Insights. This is a classic case of "spend money to make money": by putting more into preventative maintenance, operators will spare themselves major headaches down the road.
So, the question is: how can utility providers set up efficient preventative maintenance that uses data to pinpoint problems before they emerge?
If you're on our blog, you probably already know the answer. But we'll explain it in detail and show you the next steps.
What is utility vegetation management?
Vegetation management means the targeted control and elimination of unwanted vegetation. So, it follows that utility vegetation management (let's call it UVM in this article, to save your eyes from all those extra syllables) is concerned with utilities. In this case, utilities mean a service, such as electricity or water, provided to the public.
In most countries, utility infrastructure, whether it runs through public or private land, is subject to right of way. This means that the operator has the right to maintain said utility, make sure it's working properly, and remove any potential issues. And as we've already covered in the intro, vegetation is usually one of the biggest problems.
What types of satellite imagery are used for utility vegetation management?
Weather data is an important example of useful data for UVM, as high winds and heavy rain can damage utilities. But it's not strictly satellite data: it also includes ground-based observation posts and systems, weather balloons, and more. Below are the three most important types of satellite data when it comes to UVM.
Optical satellite imagery
Optical sensors take imagery in the visible or near-visible portion of the electromagnetic spectrum. They're passive sensors, which means that they use existing radiation (typically light from the sun) to capture images, instead of using their own radiation.
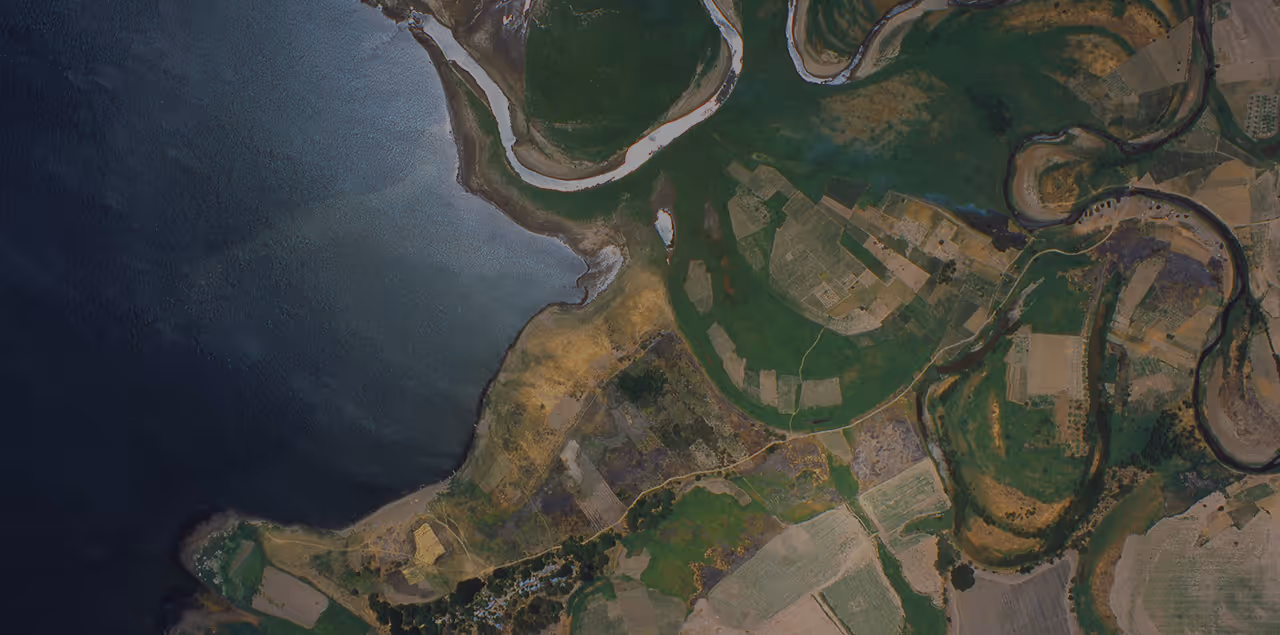
Optical satellites capture the type of imagery that most people are used to seeing, in apps like Google Maps, through the red, blue and green (RGB) bands of the electromagnetic spectrum. But they can also see things that we can't, through the red edge and the near-infrared (NIR) bands. These two bands are especially useful for detecting plant health: healthy plants have more chlorophyll, which absorbs more red and blue light, and reflects more green and near-infrared light. This allows satellite imagery to detect issues that the human eye can't yet see.
When optical satellites take imagery of the same point from two or three different locations (called stereo or tri-stereo imagery), we can combine those images to construct digital surface models, which are 3D models of the Earth's surface. These models are pretty important for utility vegetation management--more on that later.
As passive sensors, optical satellites are usually less expensive than active sensors (radar satellites). That being said, they also come with a few downsides. First, since they rely on the sun, they need to be used during the day. Second, they can't penetrate cloud cover, so if your desired area of interest is cloudy, you'll need multiple passes to fully capture it.
For more info about optical satellites, check out our dedicated blog post.
SAR imagery
Synthetic Aperture Radar (SAR) sensors, like the ones available from TerraSAR-X and ICEYE, capture imagery by transmitting microwaves at a target and catching the backscattered signals. It's so named because the motion of the platform upon which the sensor is mounted (the satellite) allows the sensor to create a synthetic antenna of sorts, continuously transmitting and receiving signals for the entire length of its orbit above the target.
In principle, this is somewhat similar to the stereo technique used by optical sensors: more data from different angles gives you more information. But while optical sensors use this method to gain elevation insights, the main benefit to SAR is a higher spatial resolution: the longer the synthetic antennae, the more detail will be captured in the image.
SAR's unparalleled acquisition capabilities are its biggest benefit. Its microwaves can penetrate clouds, along with other atmospheric conditions like haze or dust. SAR can also penetrate tree canopies and dense vegetation, to give information on different layers of vegetation. And it doesn't need sunlight, so it can capture images at any time, day or night.
SAR imagery reveals the texture of different surfaces, as smooth surfaces reflect radiation differently compared to rough surfaces. SAR can also detect the moisture content of soil, because its microwaves penetrate deeper into dry soil than wet soil.
Of course, SAR isn't perfect. SAR images require a fair amount of processing to remove noise (signal distortions) and create an image that makes sense to our eyes. And it's typically more expensive than optical imagery.
Elevation data
We've mentioned elevation data already, but it's fairly important for UVM, so it deserves its own section. Elevation data doesn't come from one type of satellite data--rather, it can be created from various types of data, including optical, SAR, LiDAR, and aerial. By constructing Digital Elevation Models (DEMs), we can get 3D models that showcase the terrain along with natural and man-made features.
These models provide tons of useful insights. For example, with a DEM that covers hundreds of miles of power lines, we can see the height of each utility tower and all the individual trees along the lines' paths, to easily detect which ones might pose an imminent threat.
How do I use satellite imagery for utility vegetation management?
You've now got an overview of the most important satellite imagery types for UVM. But how do you put this into practice and turn it into true preventative maintenance?
Let's start with some examples of different organizations that came up with satellite imagery-powered solutions.
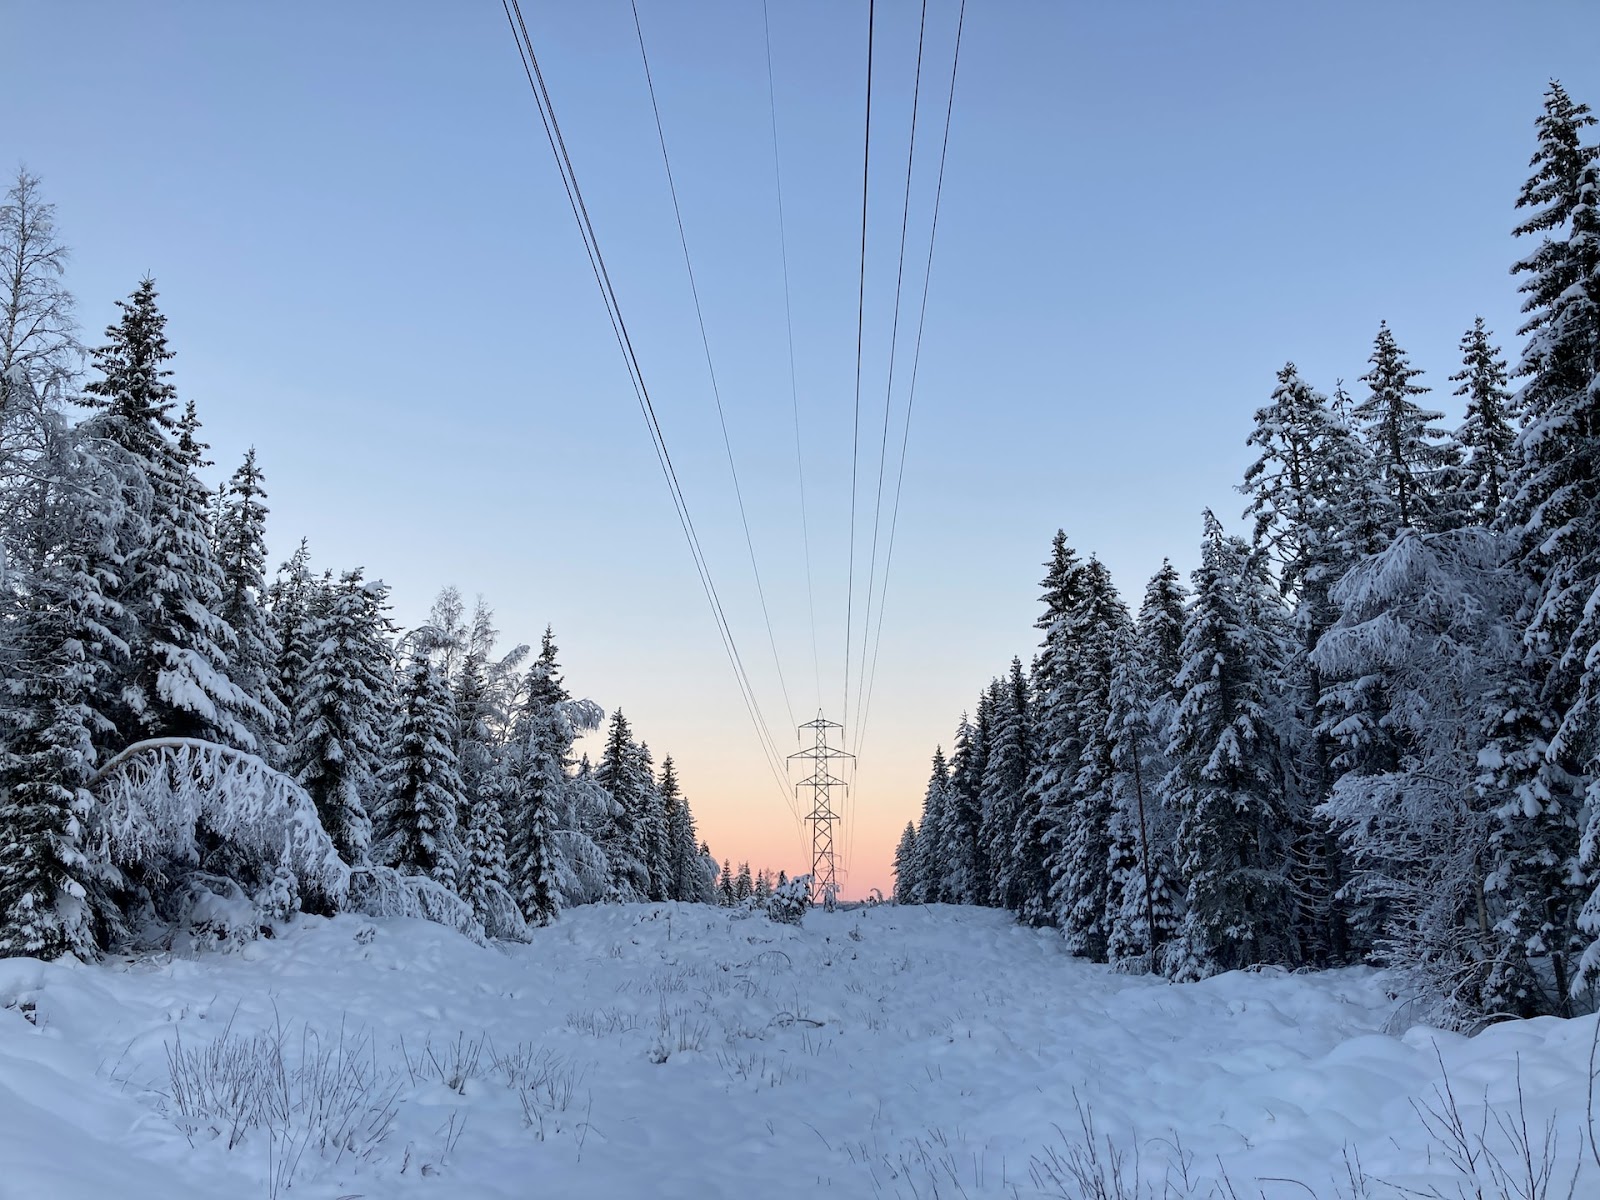
Power lines
A major utility company in the United States is responsible for over 80,000 km of power lines criss-crossing the country. Their routine for managing vegetation across that vast distance involved trimming cycles of four to five years, but that wasn't enough to be confident in preventing outages. They needed better predictive capabilities to get ahead of potential problems.
One of our customers, AiDash, helped them do just that. With satellite imagery from UP42, they built an AI model called the Intelligent Vegetation Management System that can predict the growth rate of different plant and tree species. This enabled their customer to get a far more accurate overview of threats to their power lines: they improved their system reliability by 15% and were able to cut their vegetation management budget by 20%. They can identify risks in real time and plan their preventative maintenance years in advance.
Want to learn more? Read the full story.
Railways
High-speed trains are in constant motion through most of Europe. The fastest ones can hit a speed of 320 km per hour. So if they see a fallen tree on the track, it's already too late to stop.
Fortunately, this is another case where satellite imagery comes in handy. Our customer LiveEO built a tree detection algorithm to prevent this. To use it, they generate a digital surface model with data from UP42, scale it up to cover all of Germany (and beyond where needed), and analyze it for their customers. Their clients now have an easy way to identify high-risk trees near their railways, which improves both safety for their passengers and employees, and operational efficiency. Thanks to LiveEO's solution, operators like Deutsche Bahn can now save around 25% of their vegetation management expenses.
You can read the full story here.
Some more examples
There are many more potential applications of satellite imagery for UVM:
- By combining weather data with multispectral data, utility operators can detect the likelihood of unhealthy trees toppling from strong winds and damaging utility infrastructure.
- Operators can use satellite data to analyze the state of forests surrounding utility lines for risk of forest fires, and enact preventative blackouts during high-risk periods.
- Digital surface models created with satellite imagery can assess the risk of damage to utilities from sea level rise, which will then assist in planning for preventative measures such as dikes or seawalls.
- SAR and optical imagery can be combined to fill in each other's gaps, creating coloured multispectral images that showcase vegetation health, different levels of vegetation, soil moisture levels, and material composition, all in one, enabling easier calculation of risk.
- LiDAR (Light Detection and Ranging) is a common remote sensing technique that uses laser pulses to create point clouds for areas of interest. While it's useful for mapping heavily vegetated areas, it doesn't provide all the answers. Find out how you can improve your LiDAR applications with satellite imagery.
Satellite imagery enables you to analyze huge swathes of land without needing to be there in person. It allows for more targeted and efficient solutions, sparing you days, weeks, and months of manual effort and guesswork. Slogging through swamps and marching across mountain ranges can be a leisure activity you do in your own time, instead of a work necessity.
Now, there's just one aspect of our question remaining: how do you actually get your hands on satellite imagery?
Access satellite imagery to power your utility vegetation management
The UP42 platform hosts geospatial data from the world's leading providers. We make it easy to place complex orders from different providers, all within one ecosystem, through your preferred method:
- Access the platform via browser to view available archive data in the catalog, draw an area of interest to task a satellite, and manage your orders
- Use the UP42 API to automate data ordering, retrieval, and analysis
- Use the Python SDK to order geospatial data, run analytic workflows, and generate insights
- With the UP42 ArcGIS Pro Add-in, you can access UP42 projects and data directly from your ArcGIS Pro account
There you have it. Satellite imagery is the best tool out there to enhance utility vegetation management processes. Want to improve yours? Contact us. Our team would be happy to help.

Subscribe to our newsletter
Stay up to date and learn about our fast-growing new features