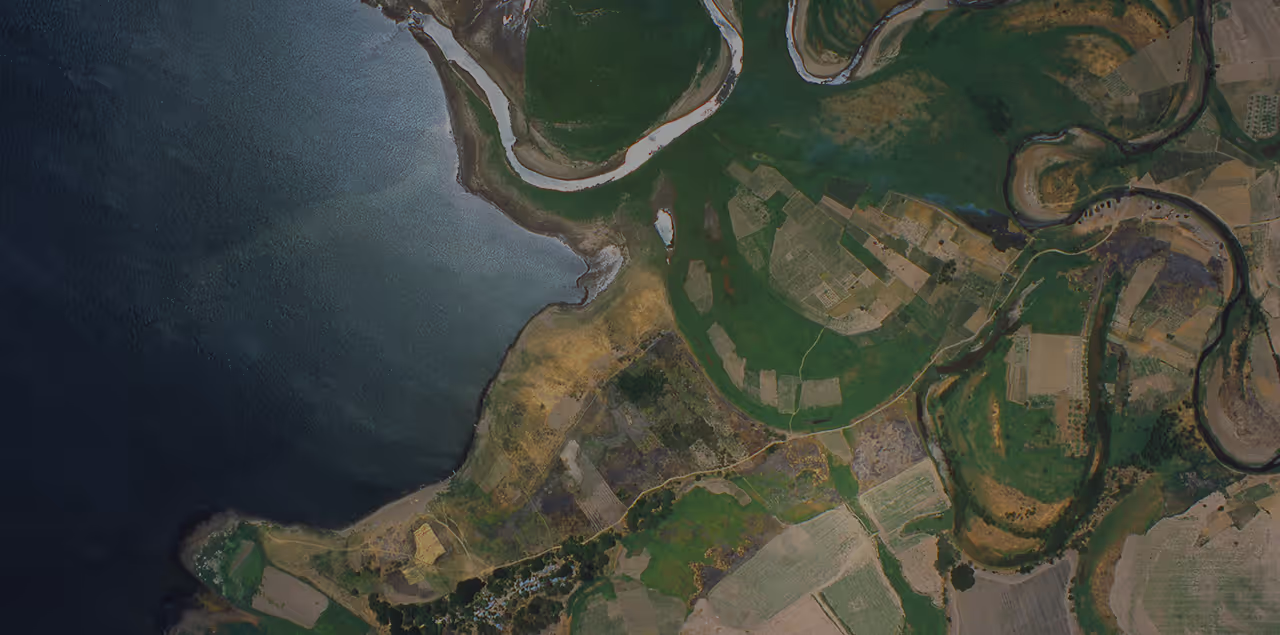
Monitor pipelines, well pads, and offshore assets from one geospatial platform
From well pad planning to pipeline right-of-way checks, get optical, SAR, hyperspectral, and elevation data from 40+ providers. Order archive imagery or task new captures, and stream it straight into your GIS.
Access the world's leading providers in one place


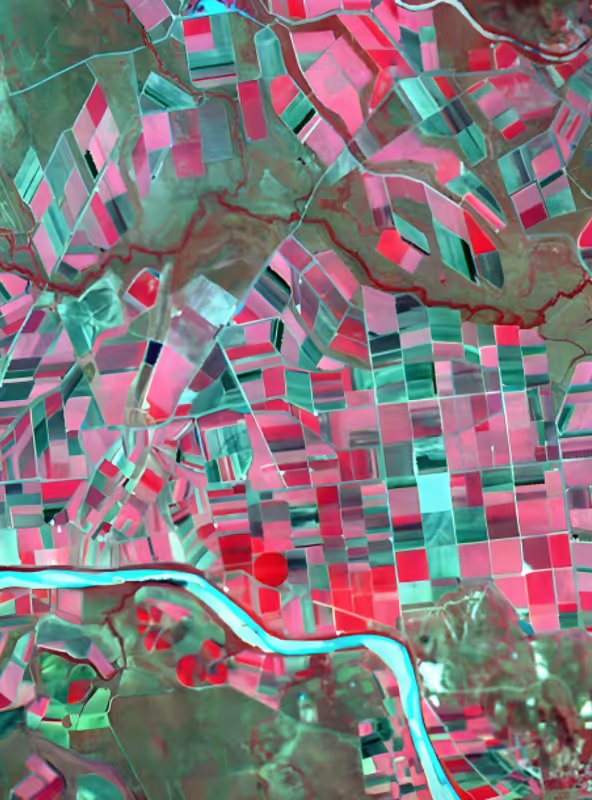
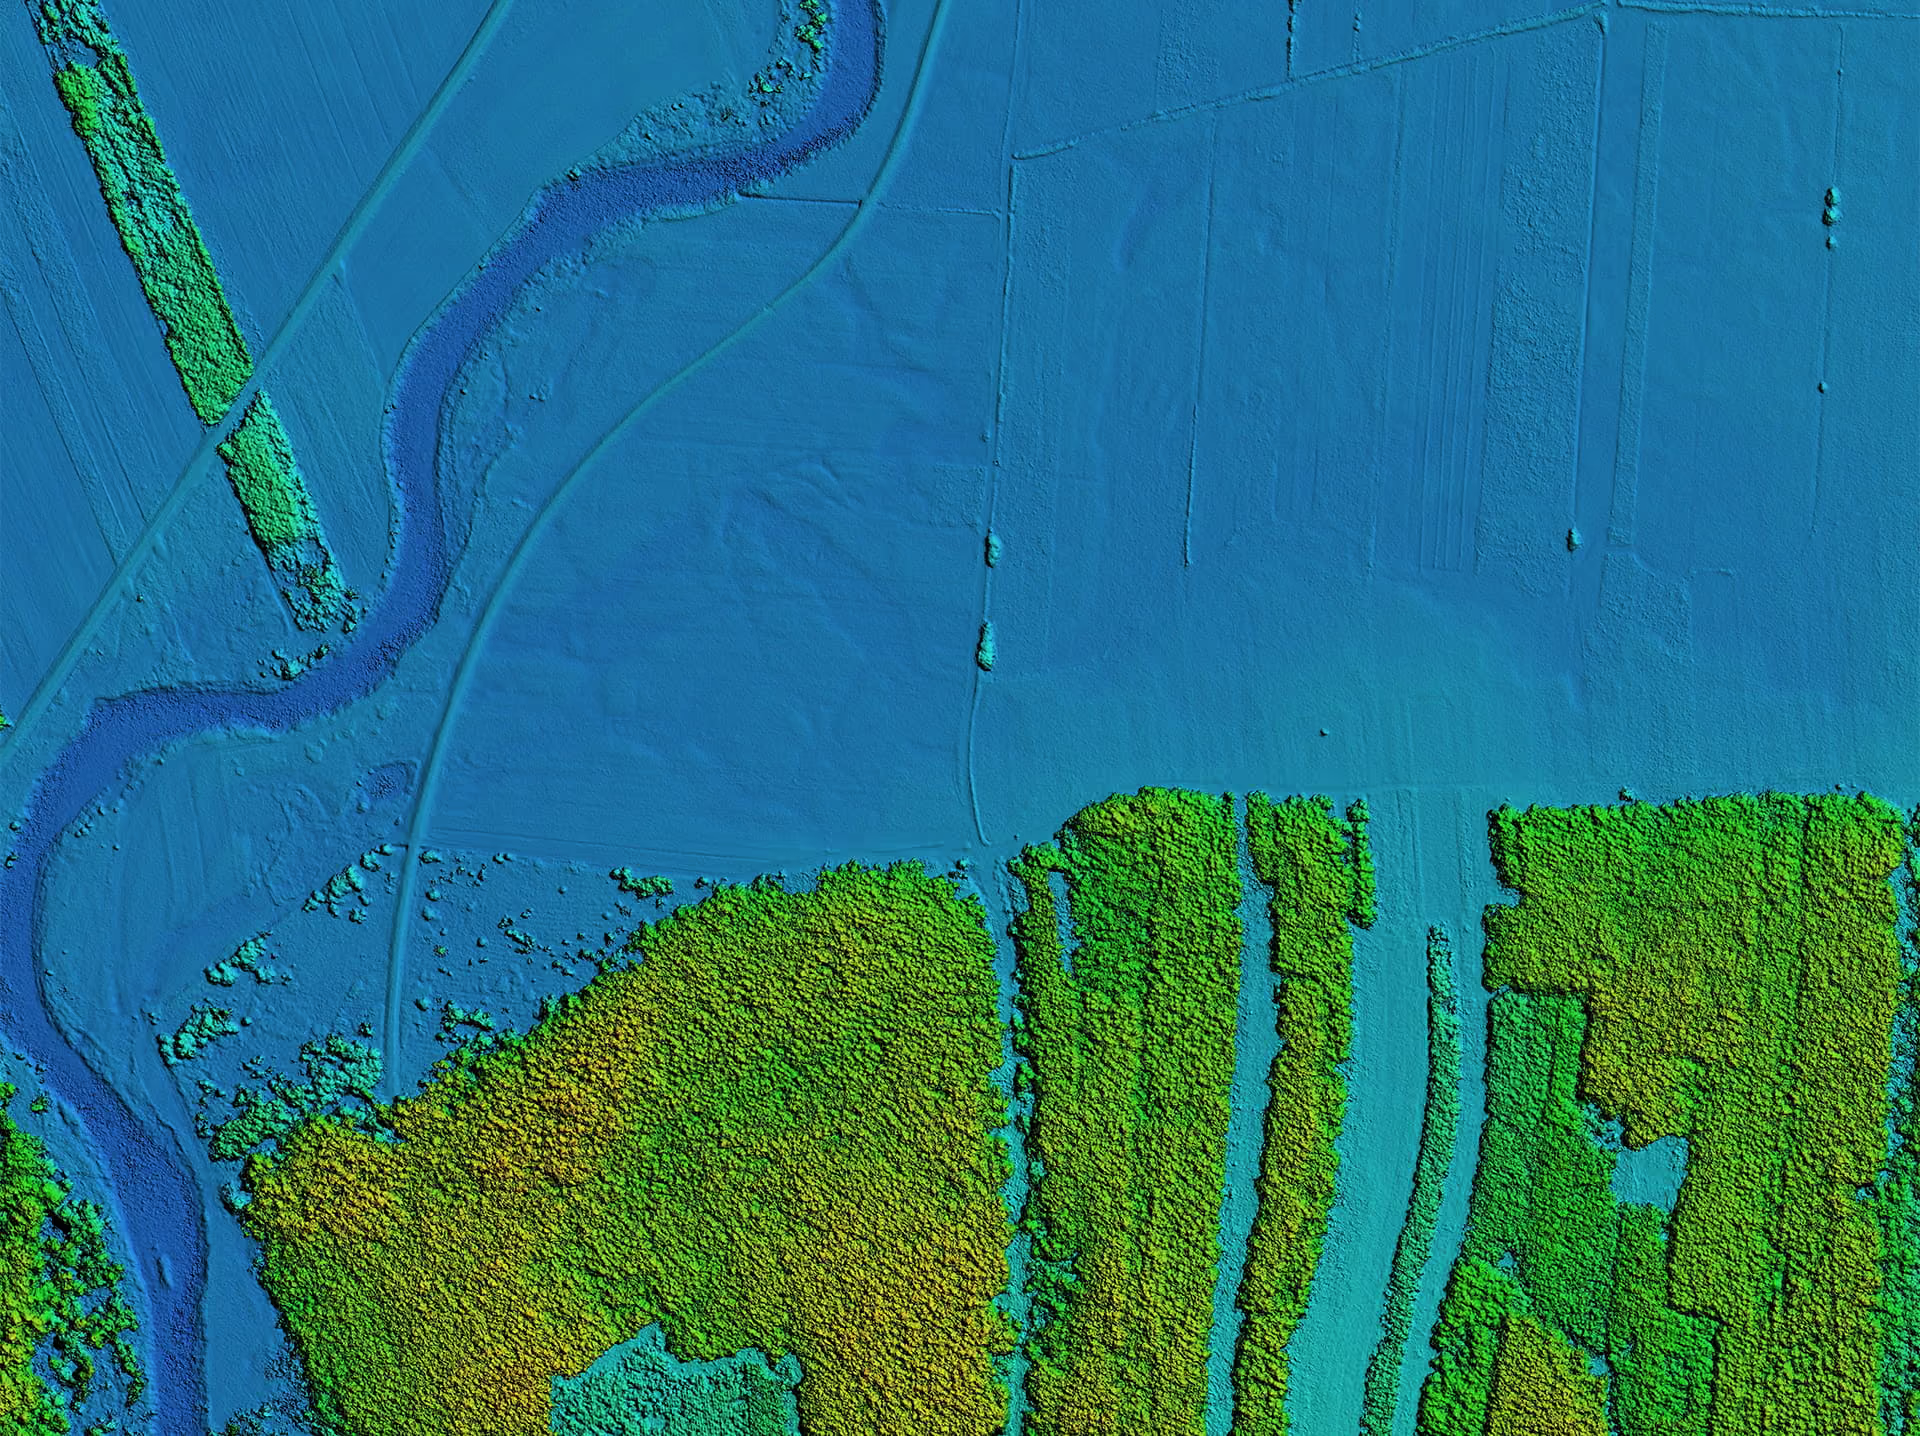
Why use the UP42 platform

One contract for all providers
Exploration, operations, and HSE teams order from 40+ providers under one contract. Add new data without new provider agreements.

Fits your GIS and pipelines
Data arrives as STAC-compatible assets in a standard format. Stream it into ArcGIS or any GIS, or automate ordering with our API and Python SDK.

Control over spend and access
Set budgets for each team or project, attribute orders to a business unit or PO, and manage access by role. SOC 2 Type II and GDPR compliant.
How to get oil and gas data in 3 steps
Define your assets and requirements
Upload your pipeline routes, sites, or areas of interest, then choose the data type, resolution, and revisit you need.
Pick archive or a new capture
Use past imagery as a baseline, or task a new capture, with extra collection capacity for critical events.

Use your data your way
Manage and process imagery in the console or via API, then download it or stream it into your GIS.
How oil and gas teams use remote sensing data
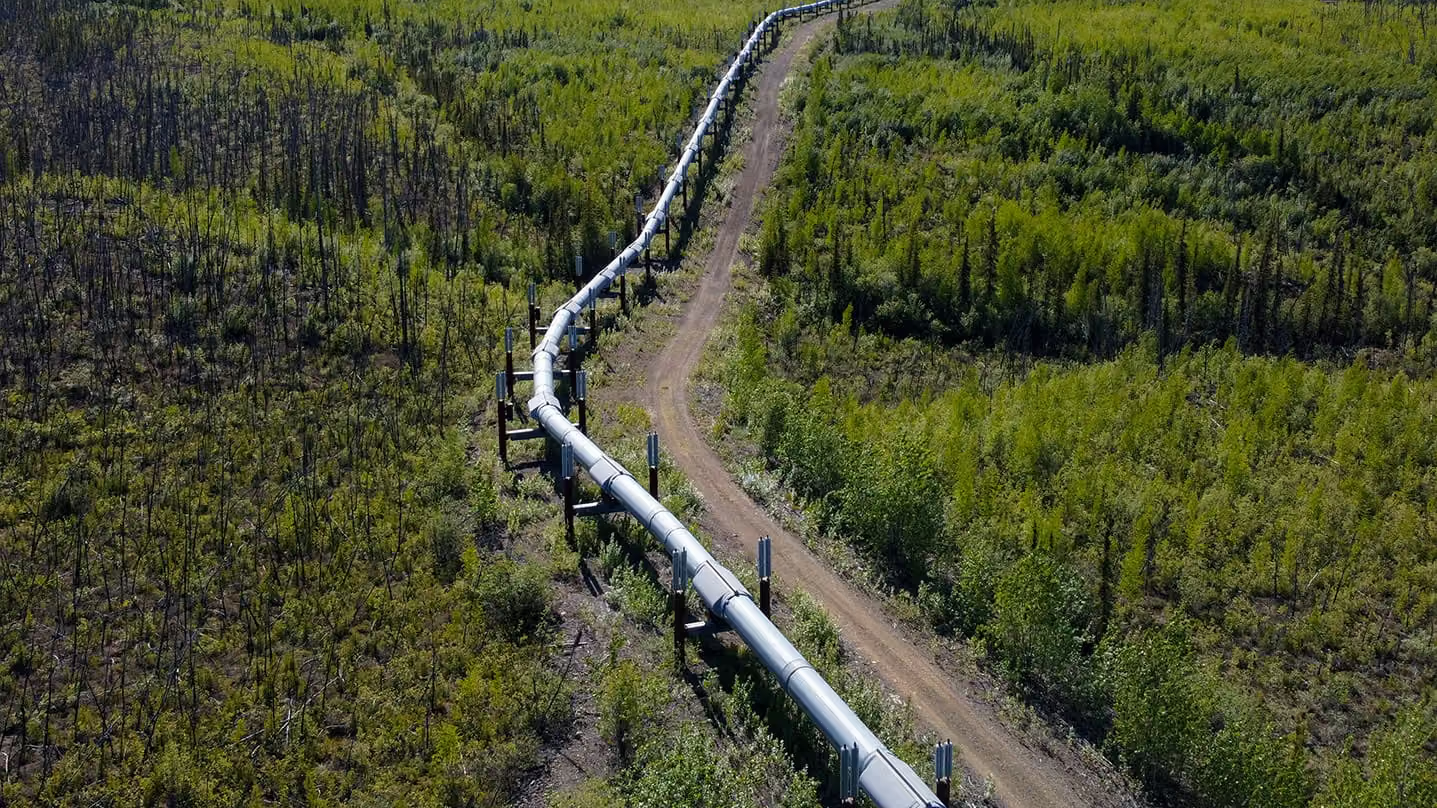
Pipeline monitoring
Monitor pipelines across remote terrain to flag unauthorized construction, vegetation encroachment, erosion, and landslips. High-revisit satellite imagery reduces costly field inspections while supporting continuous monitoring and regulatory compliance.
Asset integrity
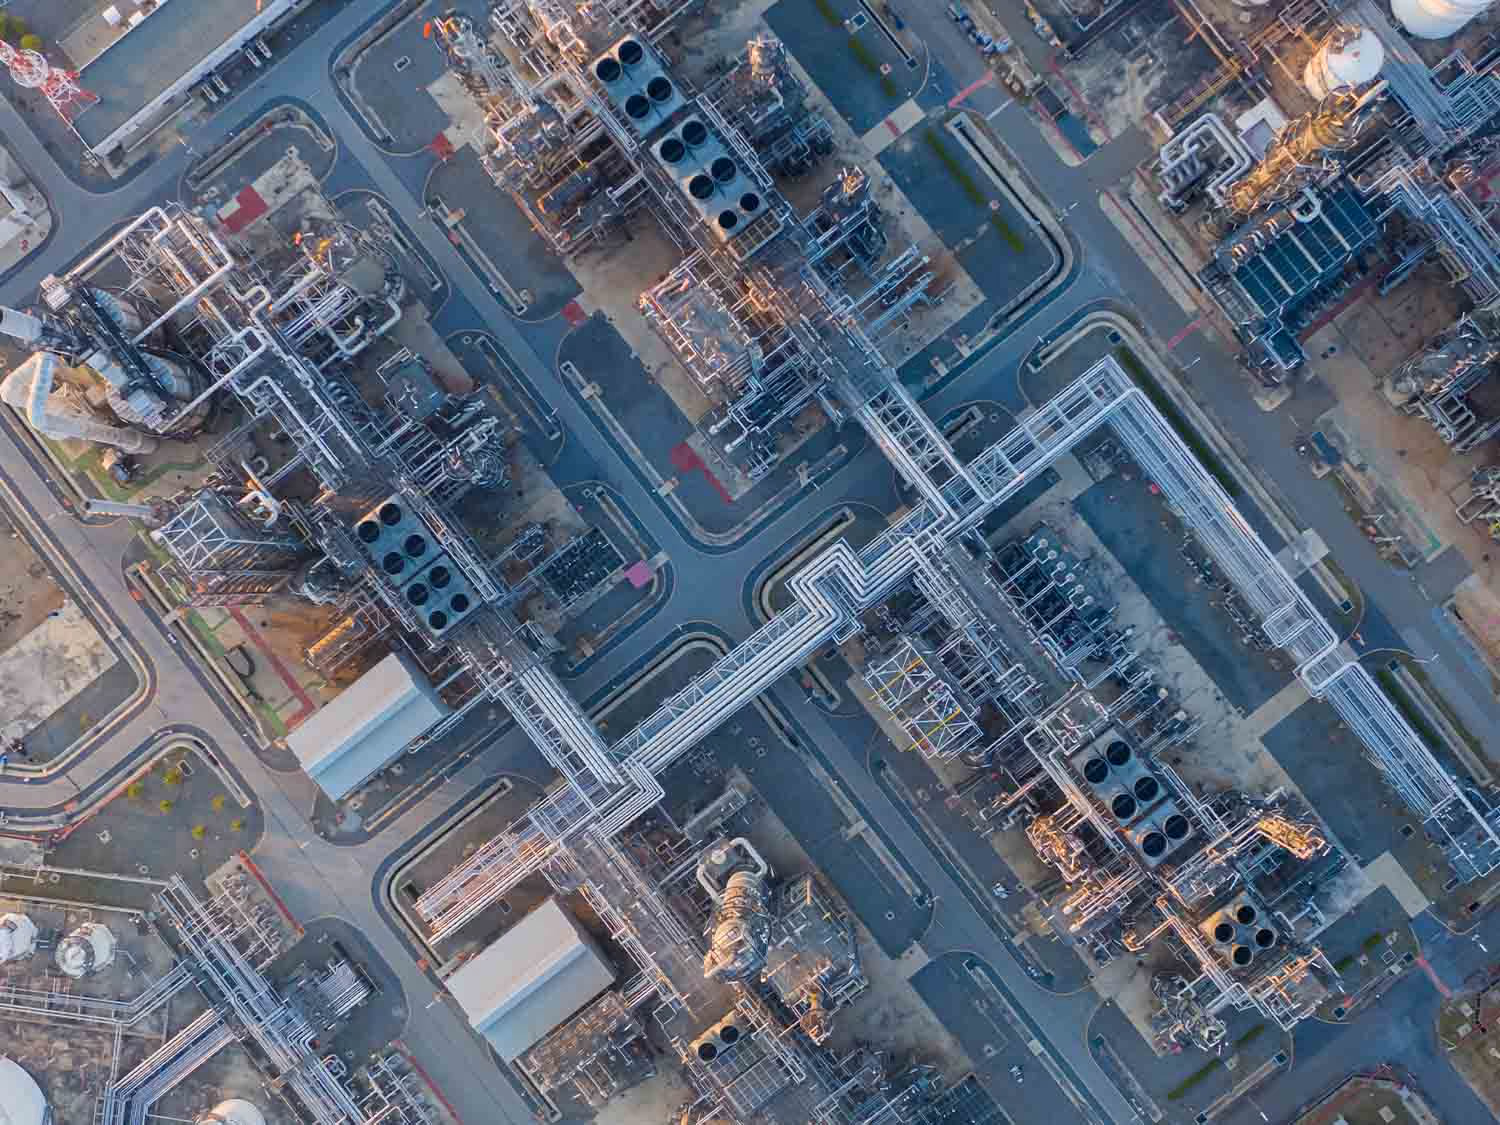
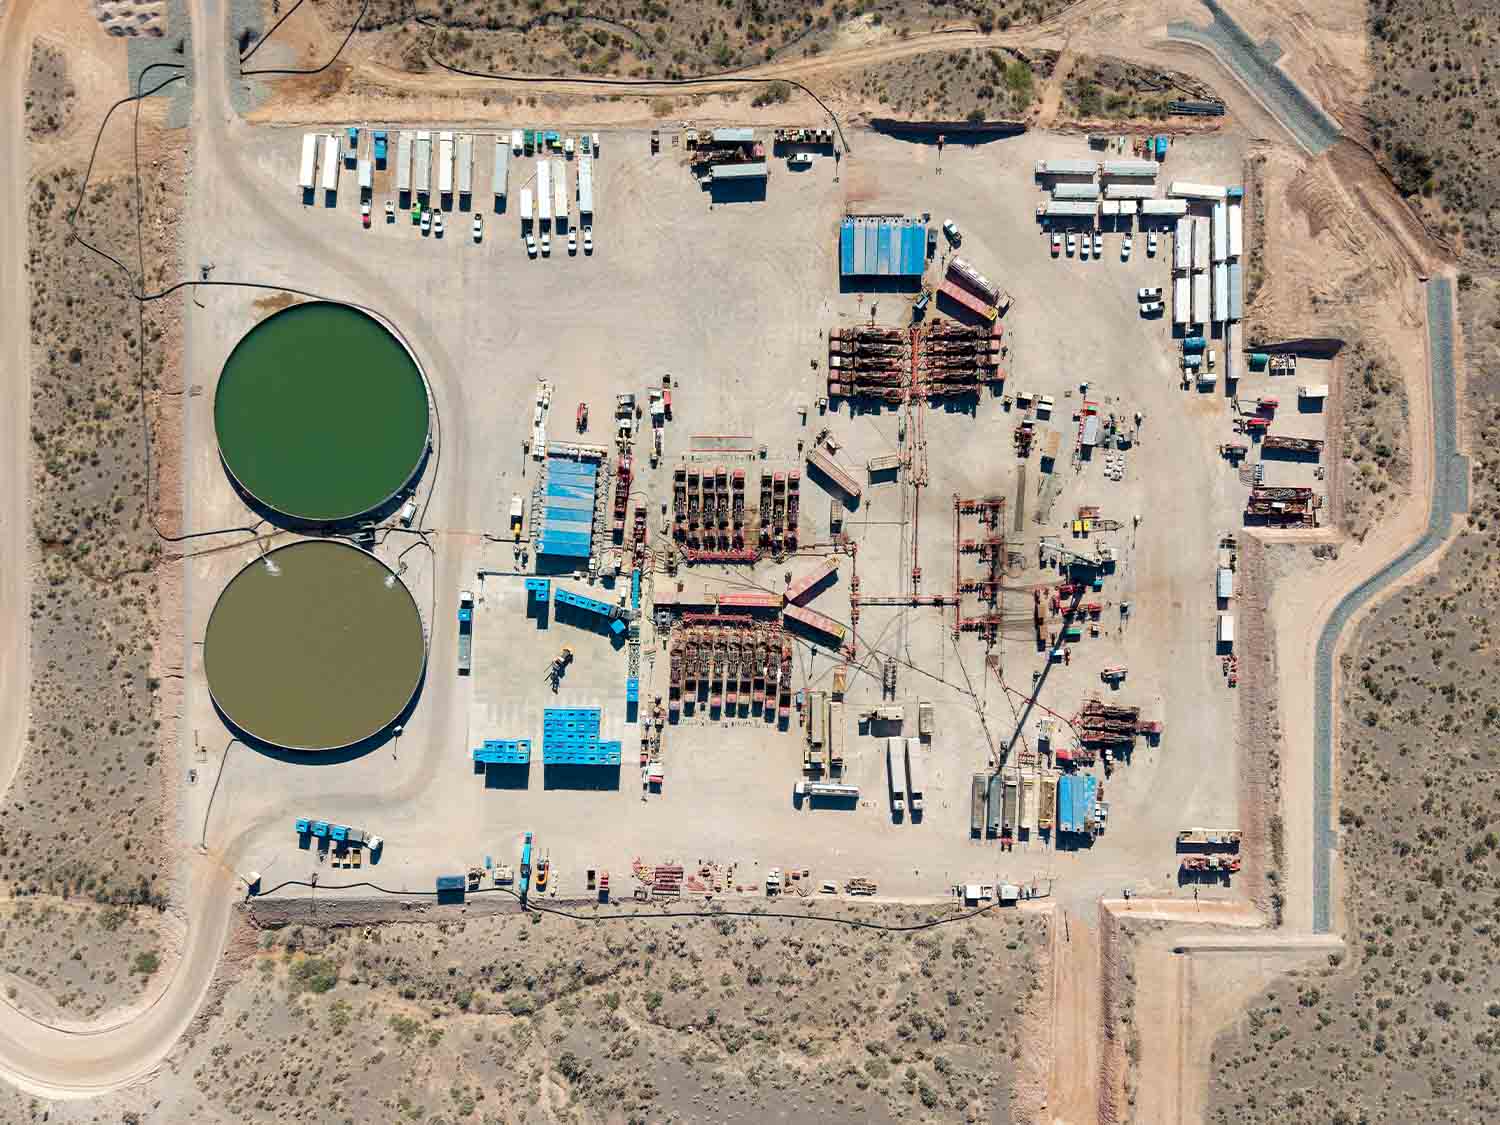
Track subtle ground movement around production sites, refineries, and other critical facilities using satellite radar. Detect subsidence, structural changes, and soil instability early to help prevent costly damage and operational risks.
Environmental monitoring
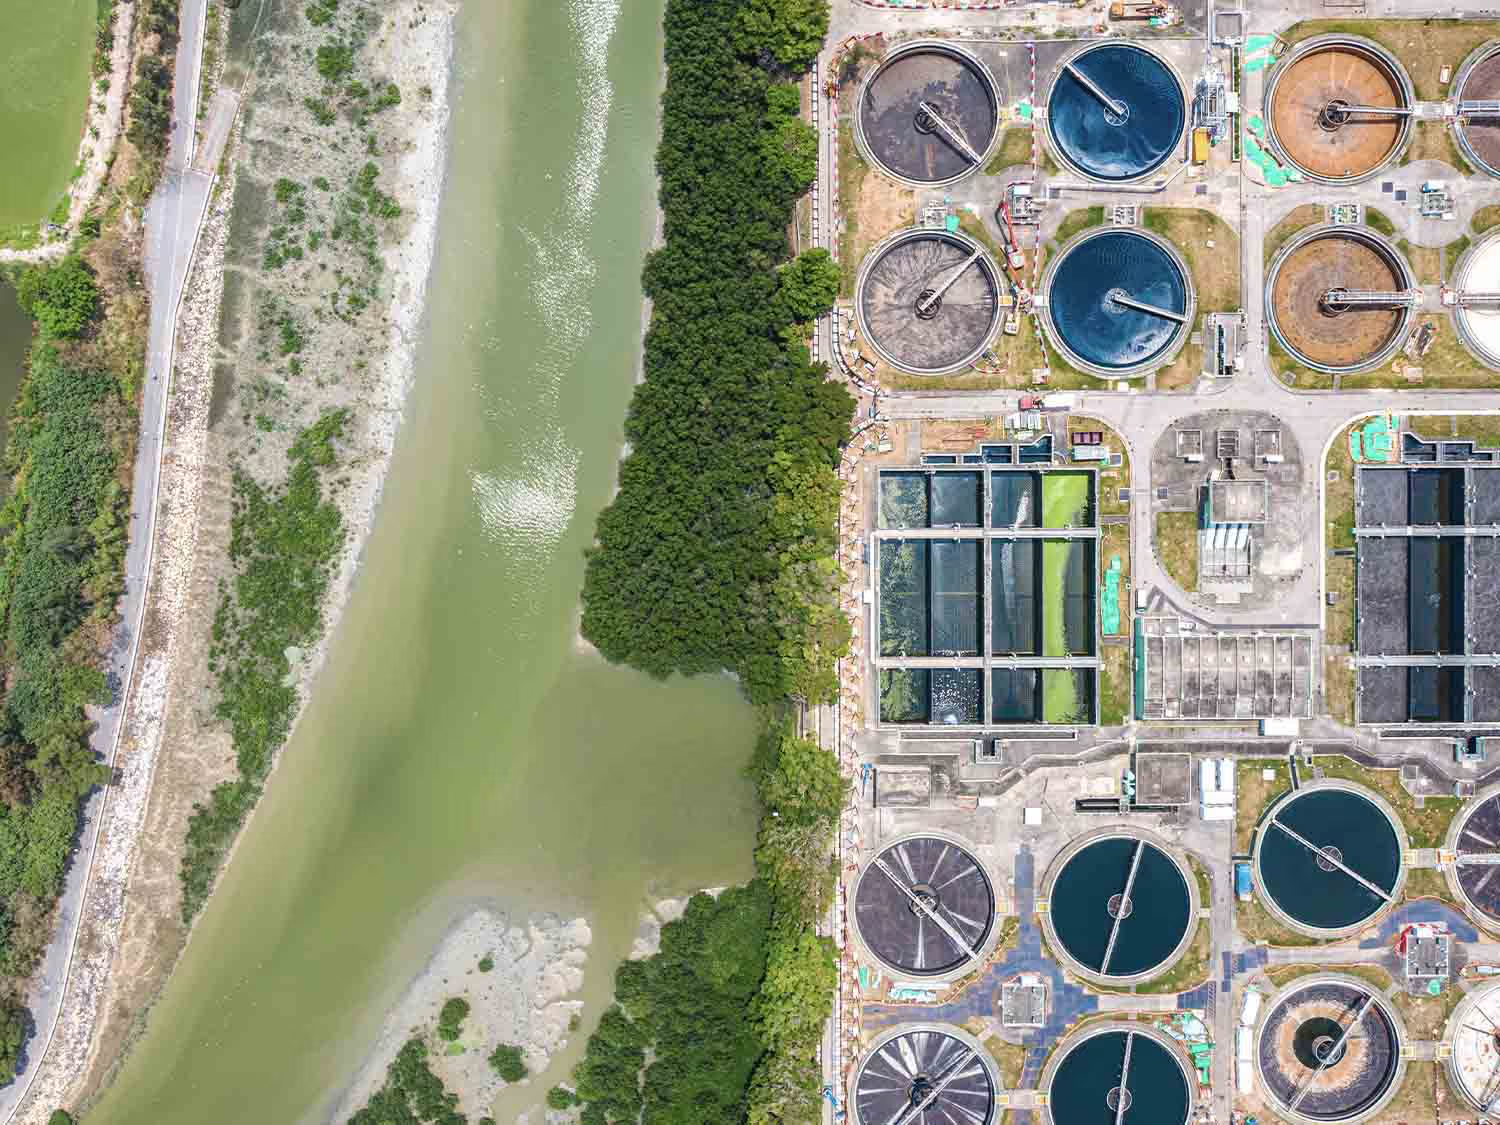
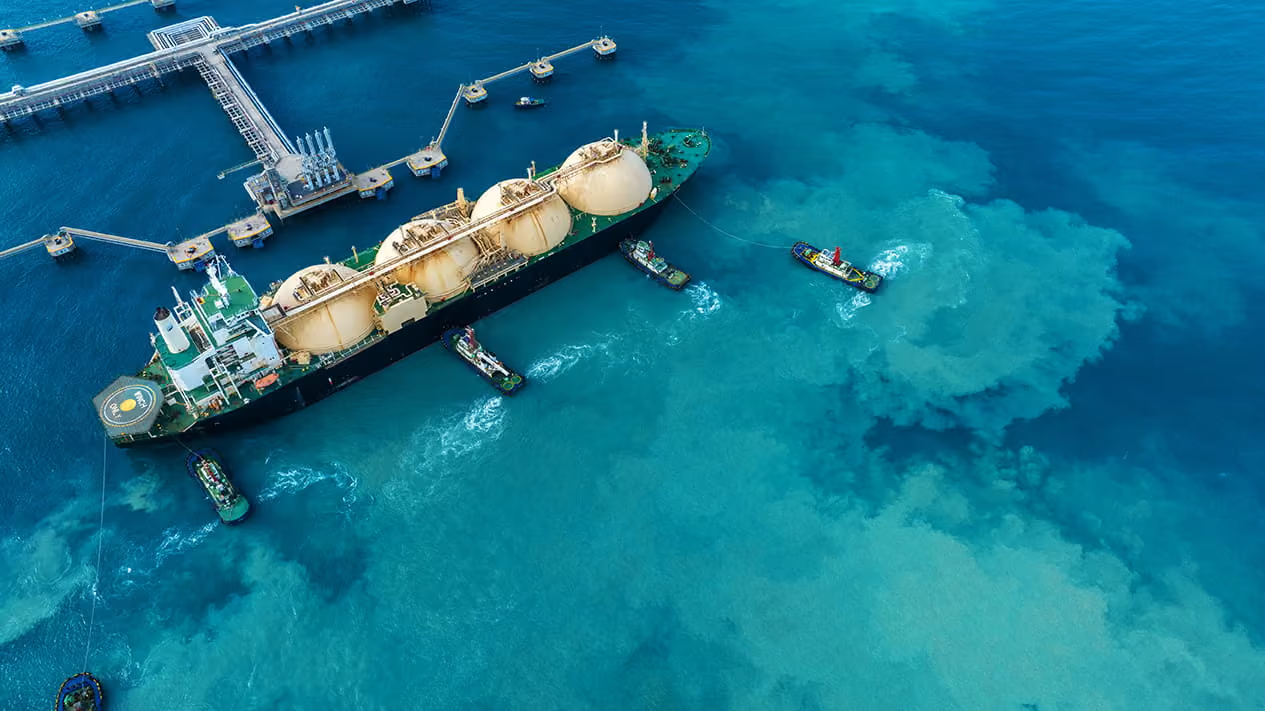
Detect methane emissions, saltwater disposal leaks, and offshore oil slicks across hard-to-access sites. Use reliable, auditable data to identify issues early, prioritize field inspections, and support regulatory compliance and emissions reduction efforts.
Exploration intelligence
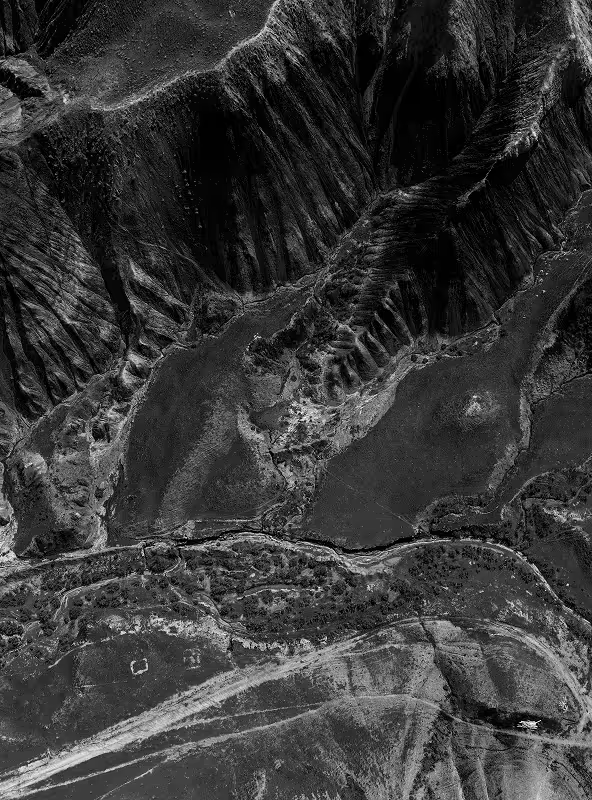
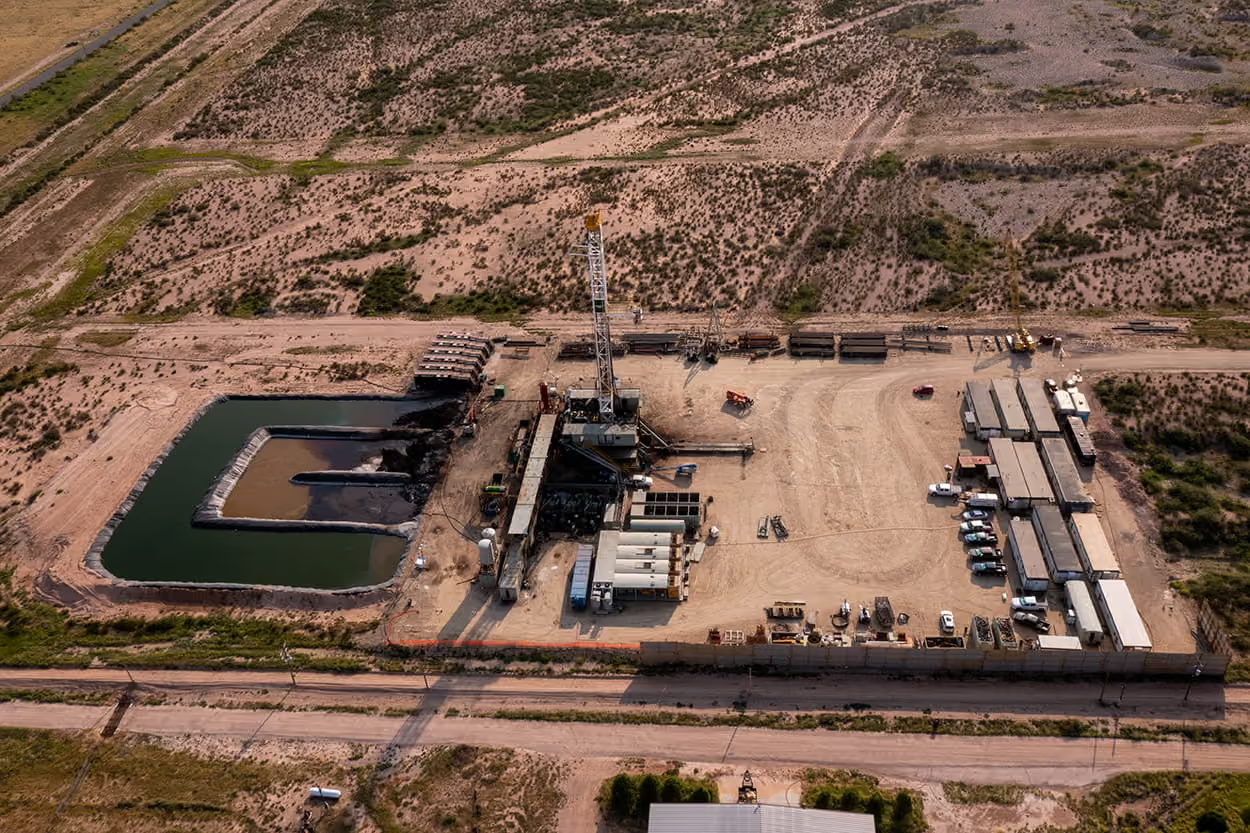
Assess potential drilling sites, geological indicators, access routes, and surrounding infrastructure before sending teams into the field. Combine multispectral and hyperspectral satellite imagery to evaluate sites, identify changes, and plan field operations.
FAQs
Here are the answers to the most frequently asked questions.
Most teams combine data types. High resolution optical imagery shows construction, vegetation, and ground disturbance along the route. SAR captures through clouds and at night, so monitoring continues in any weather. Elevation data and lidar help plan routes and spot slope risks like landslips.
Yes. Methane absorbs shortwave infrared (SWIR) light, so satellites with SWIR sensors can detect plumes from individual facilities. These include dedicated methane satellites, hyperspectral satellites with SWIR bands, and multispectral satellites like WorldView-3. For oil spills on water, teams mostly use SAR, where slicks show up as dark, smooth patches, day or night and through clouds. Optical and SWIR imagery then help confirm the spill and map its extent.
With UP42, you can open imagery in ArcGIS Pro through our add-in, or stream it into QGIS and any other GIS that supports WMTS without downloading files first. You can also download STAC-compatible assets in standard formats, or automate search, ordering, and delivery with the UP42 API and Python SDK. Data from every provider arrives the same way, so you only set up one integration.
Every provider has their own ordering process. We can’t speak for all of them, but often, there’s quite a bit of paperwork and back and forth involved.
Now imagine that you need a few different types of imagery from different providers: that’s a different contact and legal process for each one. In contrast, we offer a single point of contact to different providers, with the same interface, ordering process, standardized data formats, and ability to track and store all your orders at once from a single platform.
Even if you only need data from a single provider, UP42 simplifies the entire ordering process from end-to-end, cutting down on back-and-forth communications and delivering data that’s ready to integrate into geospatial workflows.
Still have questions?
Get in touch with us!
Explore the UP42 platform
Simplify your organization’s data access, integrations, and governance