In many places, air quality has improved dramatically during the pandemic. Here's how to measure air pollution using satellite and ground-based measurement data.
Every year, Earth Day is celebrated on 22 April in appreciation of our planet, its inhabitants, and the environment we increasingly need to protect. The theme of this year is climate action. Which is why we launched a four-part series that takes a closer look at areas of Earth that are experiencing environmental changes.
Each piece will ask and answer a question every time—using geospatial data to extract insight and raise awareness of our changing world. We’re spotlighting each of the Earth elements: Earth, Water, Air, and Fire.
Today, we’re looking at Air.
Q: Did Berlin’s air quality improve in lockdown?
Although Berlin is less affected by the pandemic compared to elsewhere—it’s the city that’s home to UP42 so we have a special interest!
The COVID-19 pandemic has grounded flights, shut down industrial activities, and slashed greenhouse gas emissions and air pollution around the world. The fight against the virus has slowed down many economies at a huge cost, while also doing wonders for the air.
All over the world, the air momentarily transformed into cleaner and clearer skies. The environment has been one of the rare positive effects of the pandemic.
After weeks in lockdown, life in Berlin has now become a little more “new normal”. As rules have relaxed and Germany’s capital loosen restrictions—we wanted to know if Berlin’s notoriously polluted air improved in lockdown.
In this article, we’ll run through how to use both ground-based and space-based satellite data to look for indications that air quality has improved in your area of the world compared to the same period in 2019 and 2018.
In many other places, air quality has improved dramatically during the pandemic. Measurements from the European Space Agency’s Sentinel-5P satellite show that during late January and early February 2020, levels of nitrogen dioxide (NO2) over industrial areas and cities in Europe and Asia were lower by as much as 40%, compared to the same period in 2019.
 Above: Air pollution plummeted in China as new daily cases of COVID-19 reached their peak. (ESA/NASA)
Air quality in Berlin
Berlin is an international city with a high quality of life and rich art, nightlife, and food scenes. But, it’s well known for its struggle with poor air quality. In the 1970s and 80s, the city tackled a huge smog problem, campaigning to get rid of coal-burning stoves. In the 90s and 2000s, particulate matter was the key issue, leading the city to introduce environment zones for low-emission vehicles.
Today, Berlin faces a different kind of air pollutant—invisible and odorless nitrogen oxides (NOx). The European Environment Agency calculated that nitrogen dioxide is responsible for more than 12,800 premature deaths in Germany every year. Across Europe, the number rises to 75,000 people.
The European Union has set the limit for NO2 at an average of 40 micrograms per cubic meter a year. But, Germany continually exceeds that limit, especially in high-traffic areas such as Berlin. To tackle this, the Berlin Senate has put up measuring devices across the city that record the concentration of air pollutants every five minutes. We’ll be looking at data from these next.
Ground and space-based data
When the pandemic reached Berlin, the city came to a halt. Shops and entertainment areas were closed, people worked from home where possible and traveled much less.
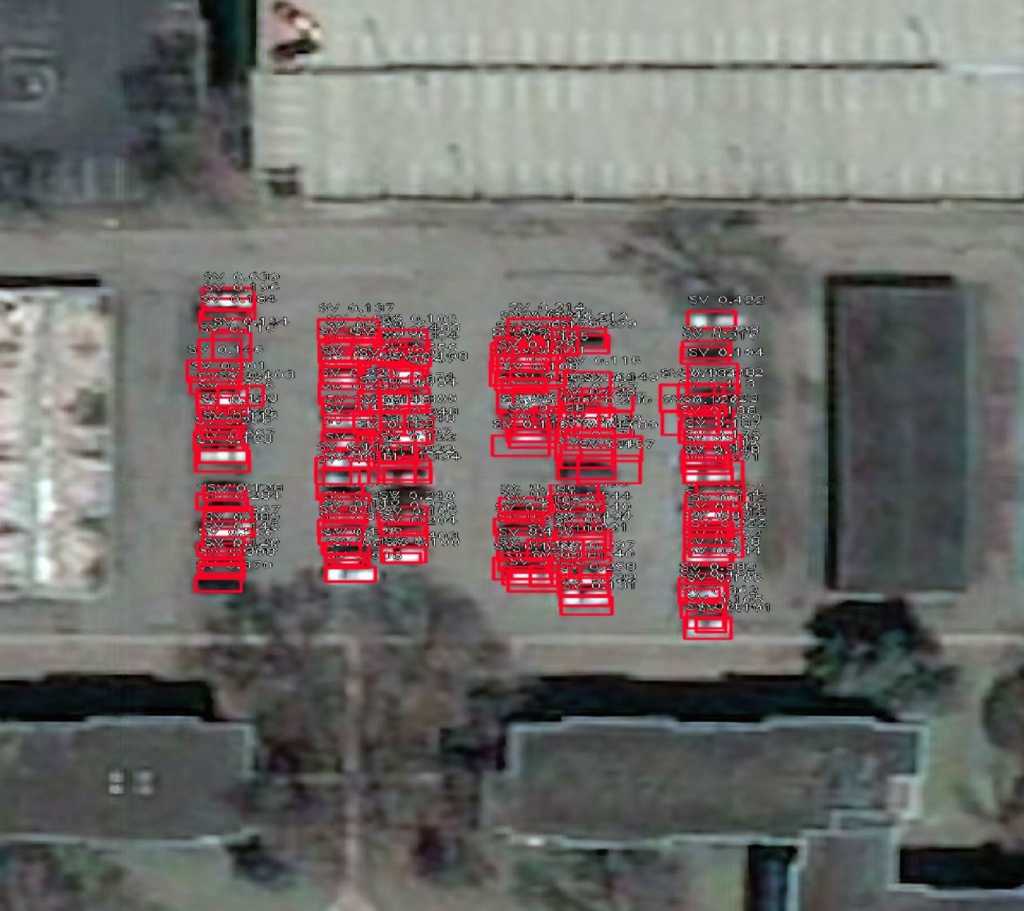
 Above: Parked aircraft at the usually busy Berlin Schönefeld airport on 28. April 2020 captured in a Pleiades satellite image.
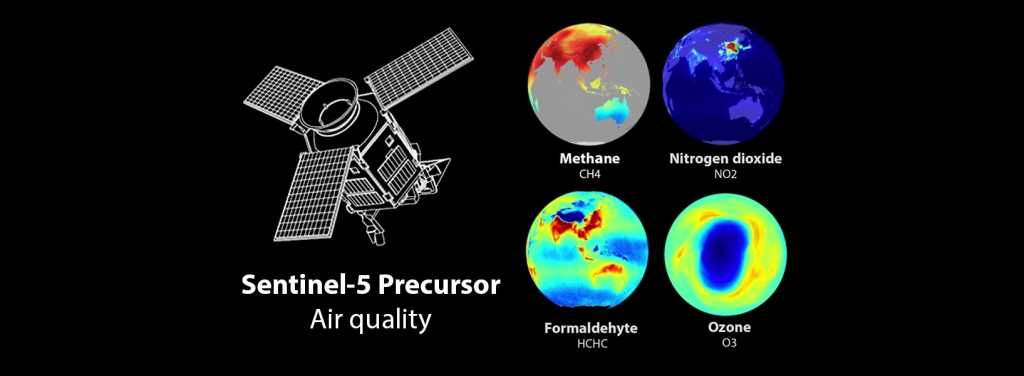
To answer our question and measure air quality we're using two types of data sources: NO2 data from ground measurement stations and space-borne data from ESA’s Sentinel-5P satellite (which detected China’s air pollution drop).
NO2 typically enters the atmosphere through emissions from vehicles, airplanes, industrial activities, and power plants. Because of this, it’s a good indicator for detecting air quality improvements due to lockdown measures that potentially affected these emitters.
Sentinel-5P enables air quality monitoring on a global scale. Compared to the measuring stations, the satellite is not limited to point observations. Instead, it provides a global picture of air quality indicators from high in space. Sentinel-5P offers unprecedented detail, with a swath width of 2600km, allowing the whole planet to be mapped every 24 hours.
 Above: A local measurement station in Berlin disguised as a truck and Sentinel 5P in orbit (Berlin Senatsverwaltung UVK, ESA).
Before we get started, it’s important to note that atmospheric air quality levels are influenced by a multitude of factors such as weather, seasonal influences, and long term trends—this can make a direct comparison problematic. So, think of this as a quick initial exploration to learn about air quality in a certain area—an easy step before diving deeper into further analysis.
How to measure air pollution in Berlin
- First let's look at ground-based air quality measurements from the Berlin Air Quality Measurement Network, provided by Senatsverwaltung für Umwelt, Verkehr und Klimaschutz.
The data is gathered from the 16 measurement stations throughout Berlin that continuously measure multiple air quality indicators such as NO2, PM10 particulate matter, ozone, sulfur dioxide, and carbon monoxide.

The graph above shows the daily average NO2 levels from 01. March - 30. April 2018, 2019, and 2020. Although 2020 (red line) seems to show slightly lower NO2 levels in the lockdown period, this can at most be interpreted as anecdotal evidence.
The variation between the other years illustrates the heterogeneous nature of time series data and the many factors that influence NO2 levels. We'll need to look at space data to gather more of an understanding.
- Now, we'll access space-based NO2 measurements collected by Sentinel-5P. Download Sentinel-5P NO2 satellite data from UP42 using the workflow builder to connect Sentinel-5P Full Scene, Sentinel-5P Level 3 Processor and NetCDF>Geotiff Conversionas illustrated below. Run this workflow as a job to start your analysis and download the results.

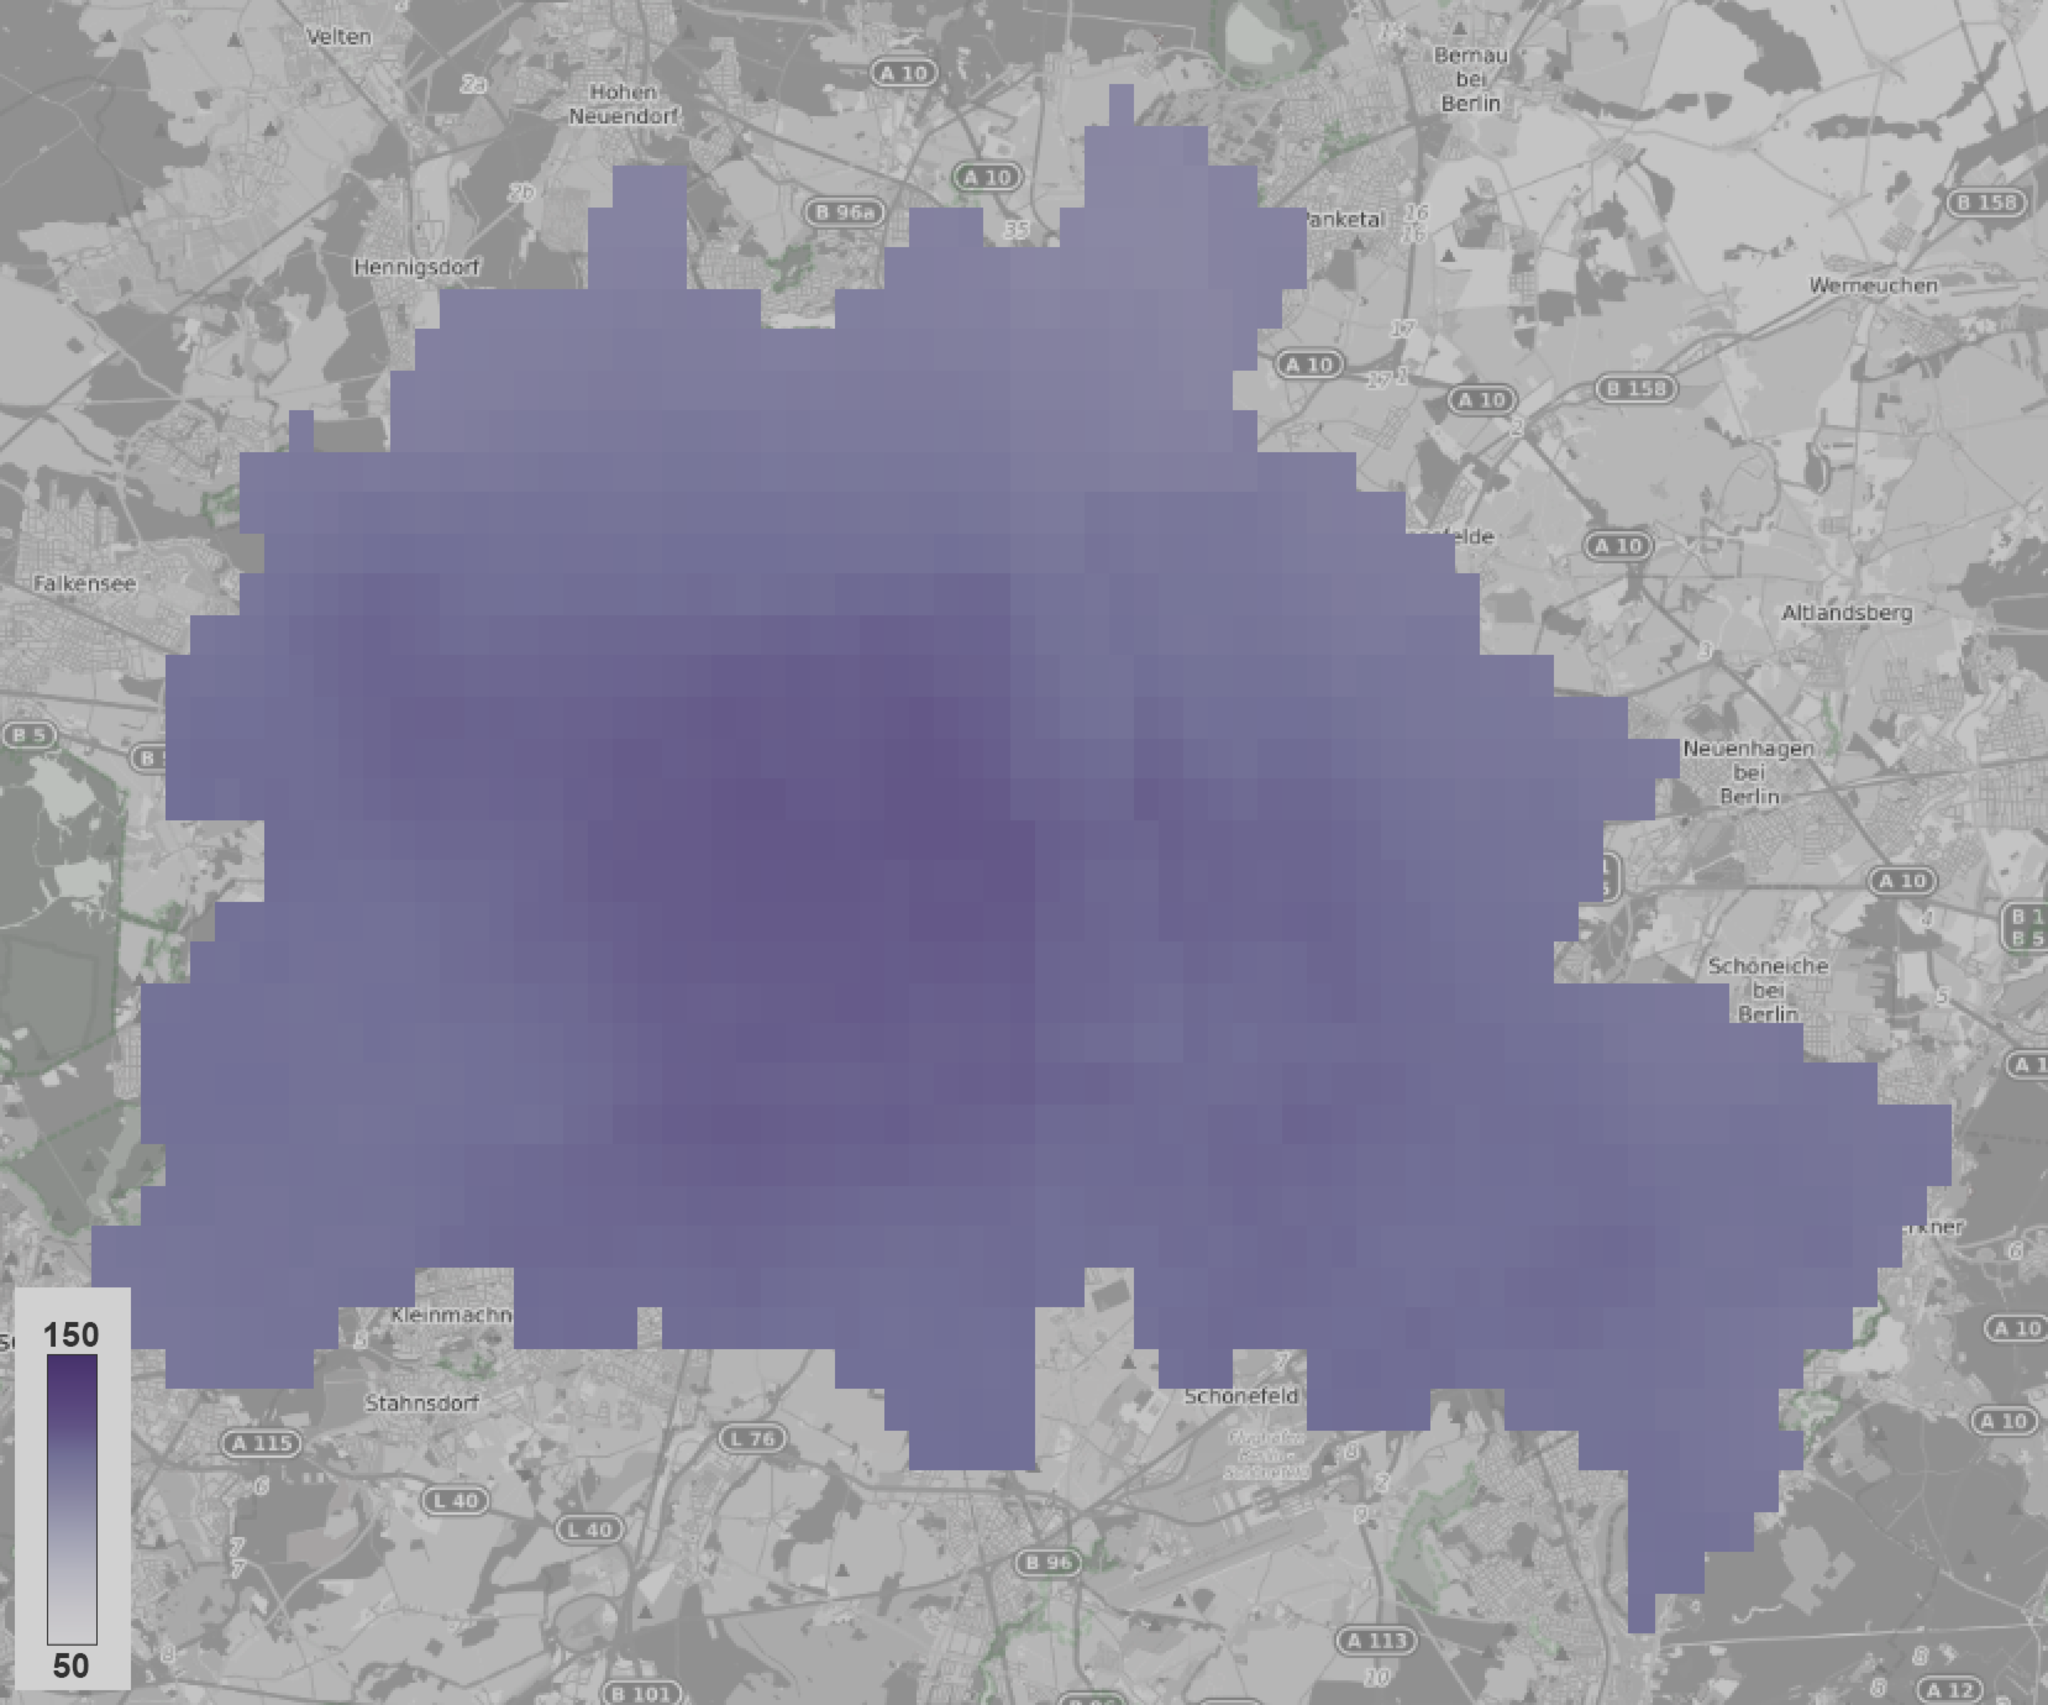
- Finally, let's interpret the results! In this side by side comparison of average NO2 levels measured by Sentinel-5P over Berlin for the 2 month period from March-May2019 vs March-May 2020, we can see slightly lower NO2 values—but in a very narrow range.
So, did Berlin’s air quality improve in lockdown?
There does seem to be some anecdotal evidence coinciding with the strict lockdown measures to curb the spread of COVID-19. However, it’s difficult to confirm a meaningful improvement of air quality in Berlin at this stage.
Concentrations of NO2 in the atmosphere are highly variable in space and time. They typically vary by an order of magnitude each day due to variations in emissions and changes in weather conditions. This is why, although we looked at two data sources and over large time periods, it remains challenging to conclude whether observed anomalies are related to changes in emissions or to changes in weather or environmental conditions.
However, there is value in doing initial analysis like this—to get an idea of how things have changed over time and begin your investigation. To take this further, we’d suggest reducing the error bar from weather variability. Conditions such as wind and rainfall need to be considered when looking at air quality data. The best approach is to combine satellite and ground-based data as we did in this piece, but with model forecasts, ideally through data assimilation. This way, the models can describe the weather impact and allow more reliable estimates of the impact of lockdown measures to be gathered.
We hope this has shown how it’s possible to quickly compare data points from space and on the ground, and explore a question or hypothesis you may have about your area of the world.
Those significant improvements in air quality seen elsewhere will likely be temporary. But being able to find answers for yourself is a useful way to keep up with the pace of change and see how air quality is fluctuating with lockdown measures in your area.
This also gives us a rare glimpse into what air quality could be like in the future as emissions regulations become more stringent. Experts in air pollution hope the crisis has shown what’s possible.
Now that economies are getting back on their feet and eventually recover, will we see that toxic haze return to our cities?
Find out for yourself and let us know what you discover!


