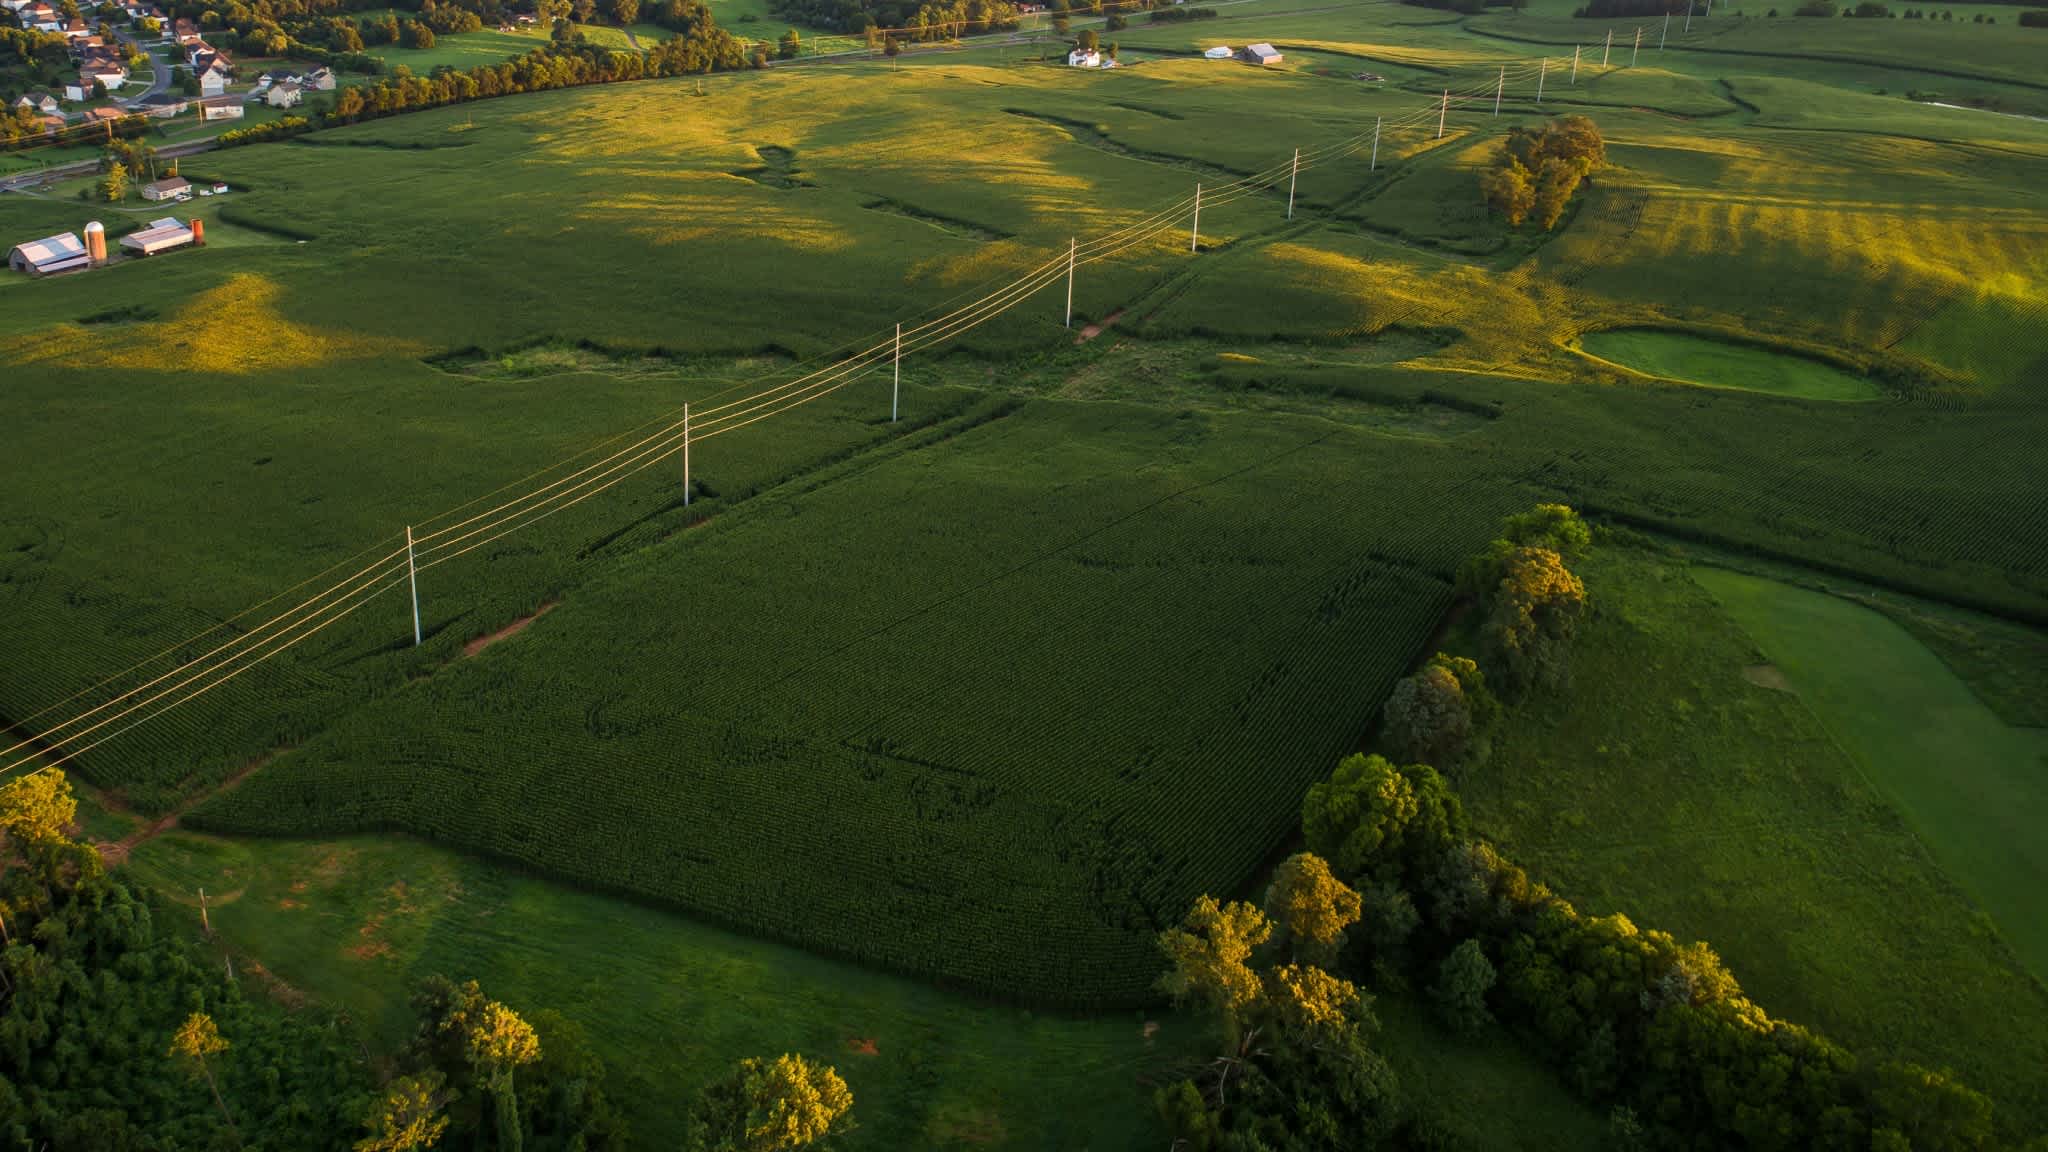
aerial-powerlines

Use Case

Monitor and Mitigate Risk to High-Value Assets

Build early warning systems for critical infrastructure, leveraging high-resolution imagery, weather data, and geospatial analytics.

Intro

Remote infrastructure monitoring with UP42

Infrastructure, such as pipelines, power lines, and railways, can span hundreds of kilometers. As a result, manual, in-person monitoring is virtually impossible. The advent of high-resolution satellite imagery and machine learning makes automated monitoring of infrastructure from individual locations to transnational powerlines a breeze.

Overview

High-resolution imagery and weather data

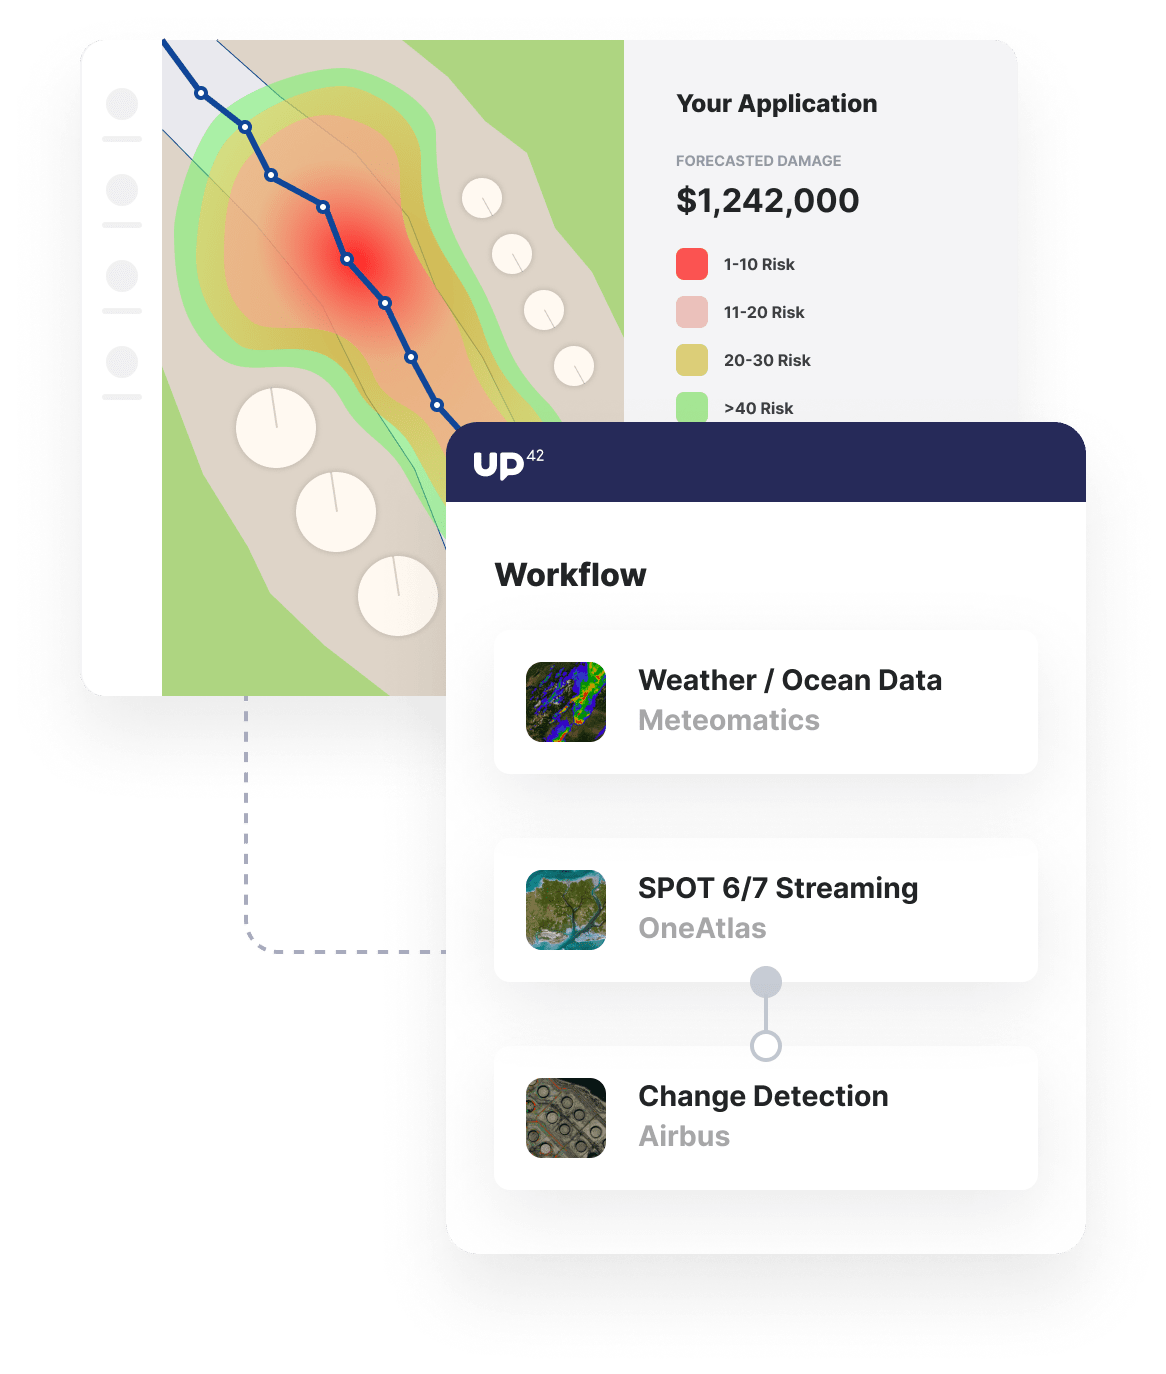
Monitor assets using high-resolution, high-revisit-rate satellites to provide recent imagery of assets. Augment analysis with 1000 weather parameters.

Change detection and risk prediction

Detect change to areas surrounding critical infrastructure and implement alert systems for high-risk weather conditions.

Integrate into alert systems

Use our toolkit to seamlessly integrate data and processing outputs into existing or new geospatial products and early warning systems.
usecase-asset-monitoring
Remote Asset Monitoring > Use Case 2

Benefits

Benefits for you

  • Save costs by purchasing only the data and processing the algorithm covering exactly your customer's AOI.
  • Save time by utilizing our APIs to automate your analytics workflows fully.
  • Avoid costly and time-consuming setup by building on our tried-and-tested infrastructure.
  • Supplement archive data with the latest data, utilizing our bespoke tasking service.

Benefits for your customers

  • Get timely insights to proactively respond to infrastructure risk, avoiding costly outages or property damage.
  • Easily detect different types of encroachment, from settlements to vegetation.
  • Ensure data, and therefore insights, are as near-real-time as possible.

The technical details

How can you use UP42 to build remote asset monitoring solutions?

Building blocks

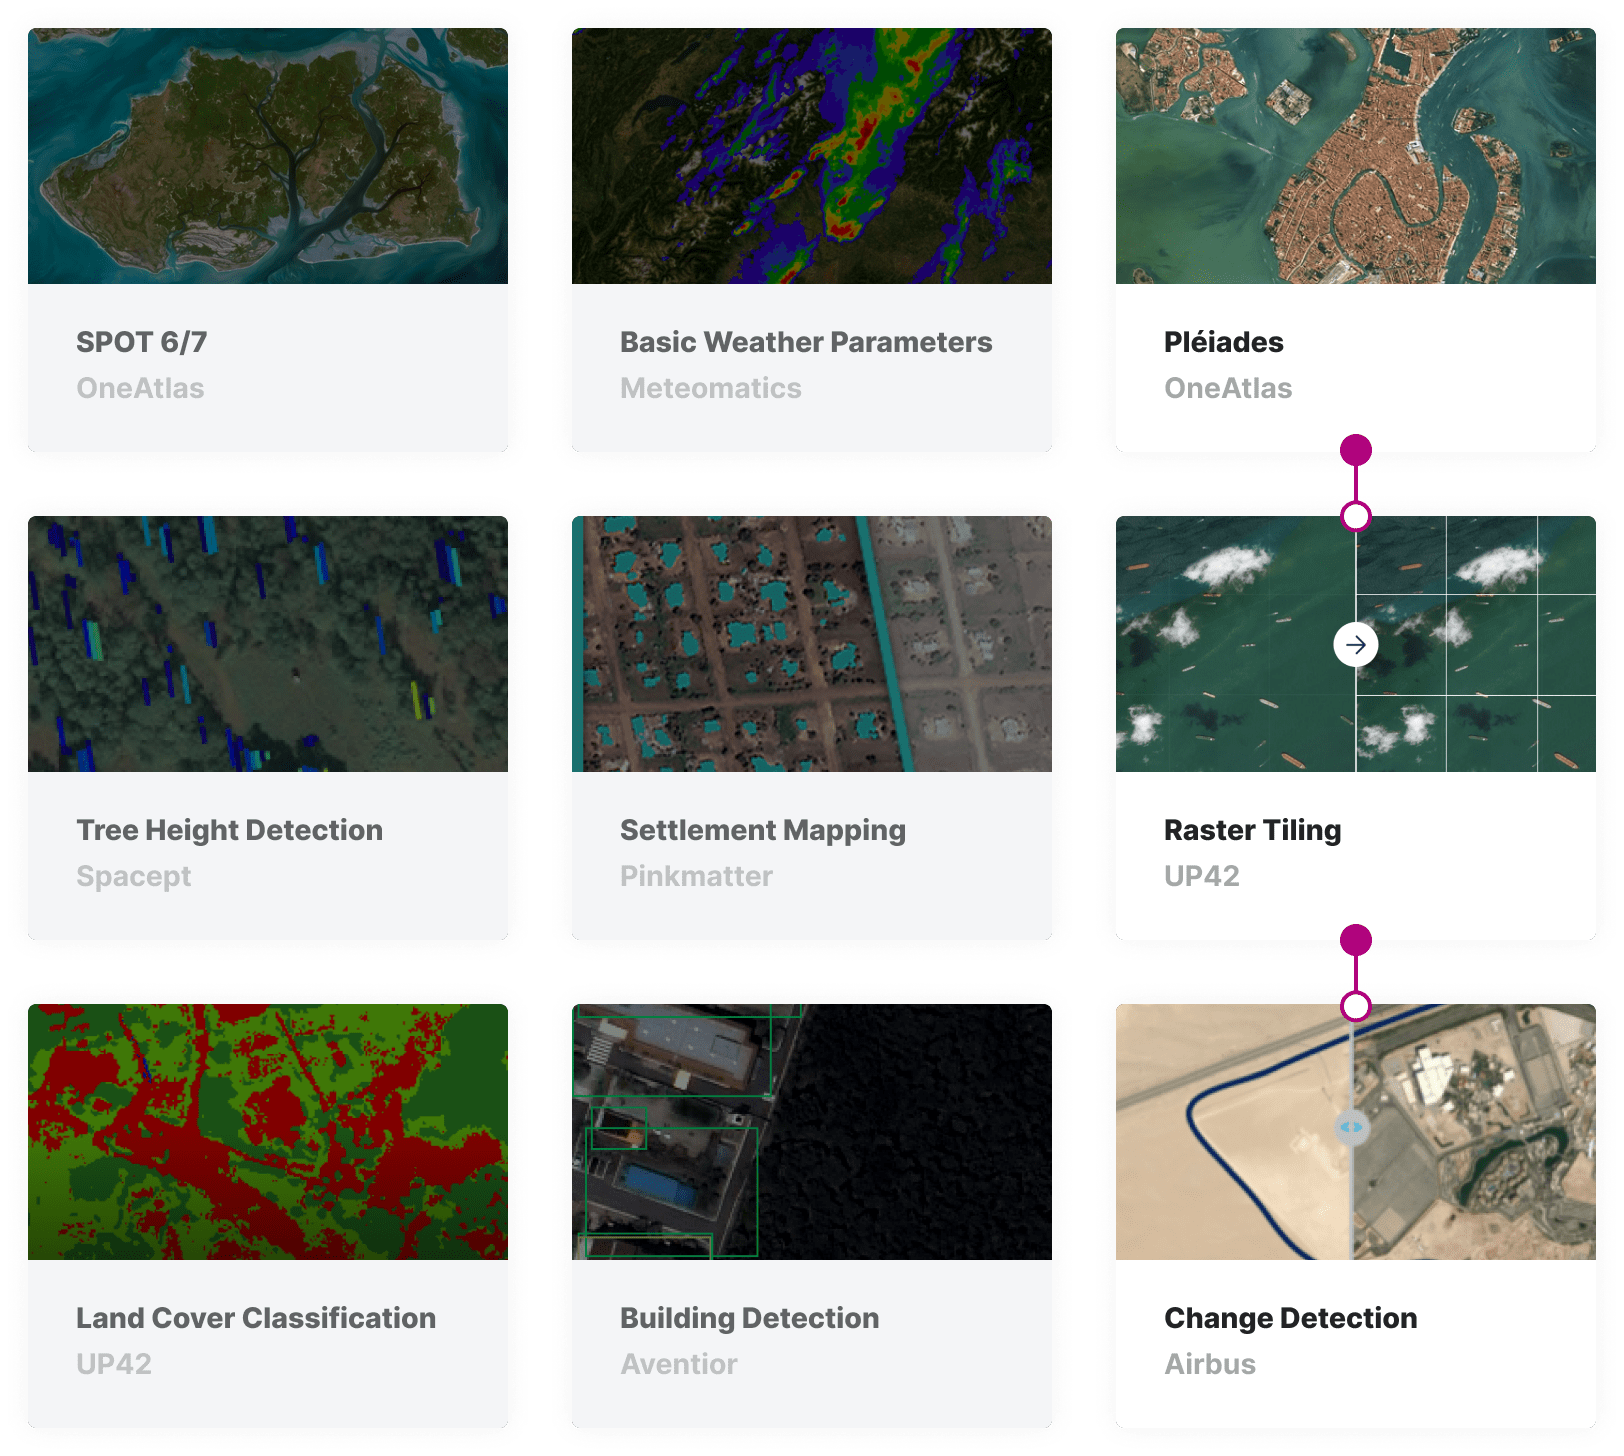
Choose your data and analytics

Create a workflow using data and analytics from vast options available on the UP42 marketplace. Or make UP42 your own but bringing in your own data and algorithms to run on our scalable infrastructure. Choose from a range of satellite data sources, weather data, aerial data, and more to feed pre-processing and machine-learning algorithms that are perfect for detecting change.

marketplace-asset-monitoring

Processing

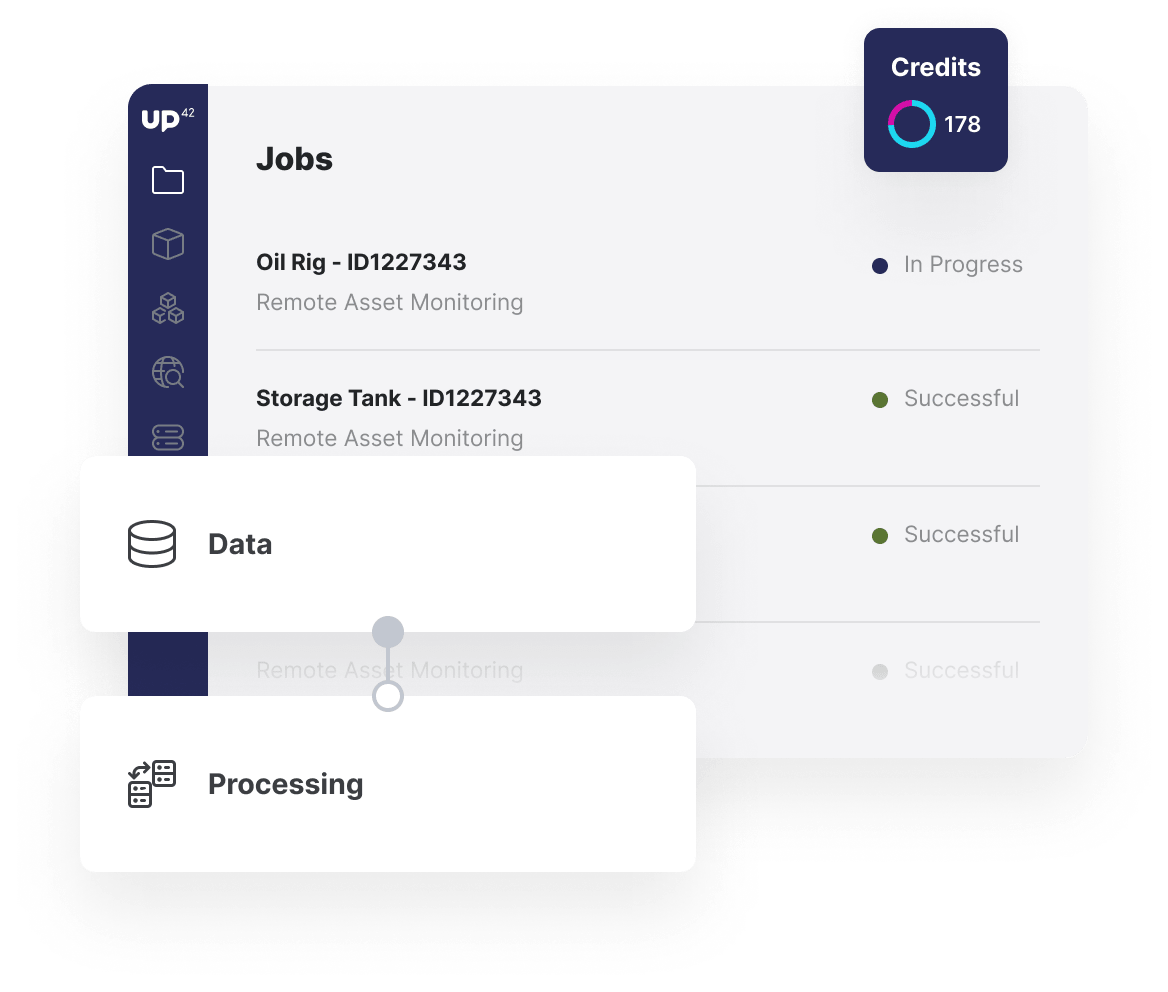
Apply algorithms to your data

Once you've built your workflow, trigger your analysis with full transparency into progress and pricing. Jobs can be triggered manually or automatically through the API to automatically run analysis when new archive data is available for your customer's area of interest and requirements, such as cloud cover.

jobs-workflows-asset-monitoring

Supplemental data

Access additional variables

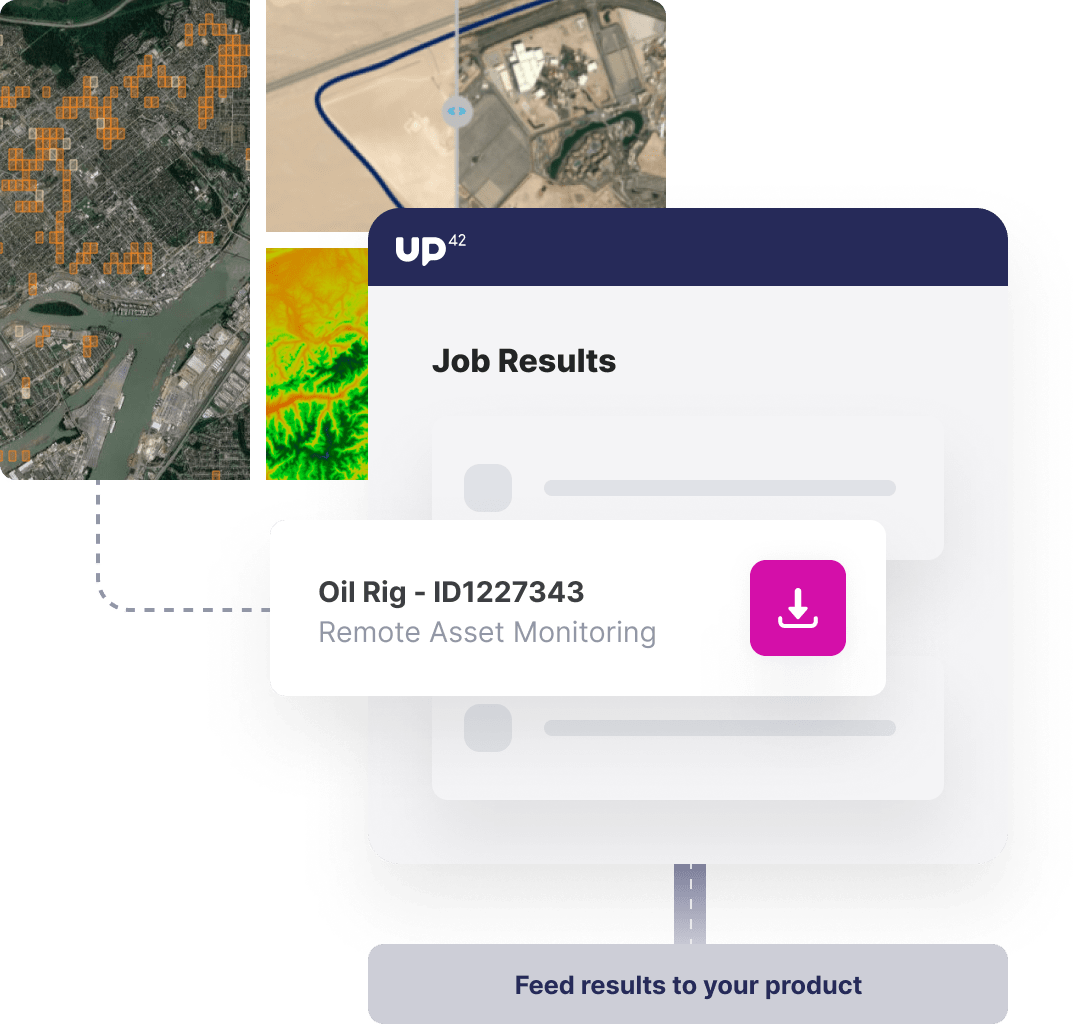
Combine the outputs of your change detection algorithms with other data that, without additional processing, can provide early warning signals. For example, you can access 1000 weather parameters, including forecasts, on the UP42 platform that can warn forthcoming extreme weather conditions. Additionally, high-resolution digital elevation models can, over time, be used to illuminate changes to the landscape that indicate increasing geological risks to infrastructure.

custom-blocks-asset-monitoring

API

Automate insights and alert your users

With UP42's Python SDK, you have the toolkit to trigger analytics workflows and receive insights directly in your systems. As a result, you can embed the outputs of UP42 workflows into your customers' legacy systems or in purpose-built early warning systems. Using Python, you can build alert systems if outputs of models or raw data fall outside of safety thresholds.

Access our Python SDK

import up42
up42.authenticate(project_id="12345", project_api_key="12345")
project=up42.initialize_project()

# Detect change around asset
workflow = project.create_workflow(name="Asset", use_existing=True)
input_tasks=['oneatlas-spot-aoiclipped', 'tiling', 'change-detection']
workflow.add_workflow_tasks(input_tasks=input_tasks)

parameter = workflow.construct_parameters(
    geometry=[13.442438, 52.510841, 13.444122, 52.511957],
    geometry_operation="bbox",
    scene_ids="DS_SPOT6_202003141002022_FR1_FR1_FR1_FR1_E014N53_01952")
parameter["tiling:1"].update({"match_extents":True})

job = workflow.run_job(input_parameters=parameter, track_status=True)
job.download_results()

# Get weather data around asset
workflow = project.create_workflow(name="Weather", use_existing=True)
input_tasks=['meteomatics']
workflow.add_workflow_tasks(input_tasks=input_tasks)

parameter = workflow.construct_parameters(
    geometry=[13.442438, 52.510841, 13.444122, 52.511957],
    geometry_operation="bbox",)
parameter["meteomatics:1"].update({
      "time": "2020-01-01T00:00:00+00:00/2020-01-01T01:00:00+00:00",
      "variables": ["wind_speed_100m:ms"],
      "time_interval": 6,
      })

job = workflow.run_job(input_parameters=parameter, track_status=True)
job.download_results()

Explore the platform

Create an account to order, access, and analyze geospatial data.

Get started