aerial-fields

Use Case

Gain the geospatial edge in financial markets

Provide financial traders with an edge by analyzing the fundamentals of publicly-traded agricultural companies by monitoring key crop health.

Intro

Market predictions with geospatial monitoring

Commodity trading has become dominated by the rise of high-frequency trading bots acting instantly based on imperceptible market movements. For financial traders to gain an edge in this market, they must widen their knowledge base beyond traditional industry reports towards cutting-edge, holistic geospatial analysis.

Overview

Regular Sentinel-2 imagery

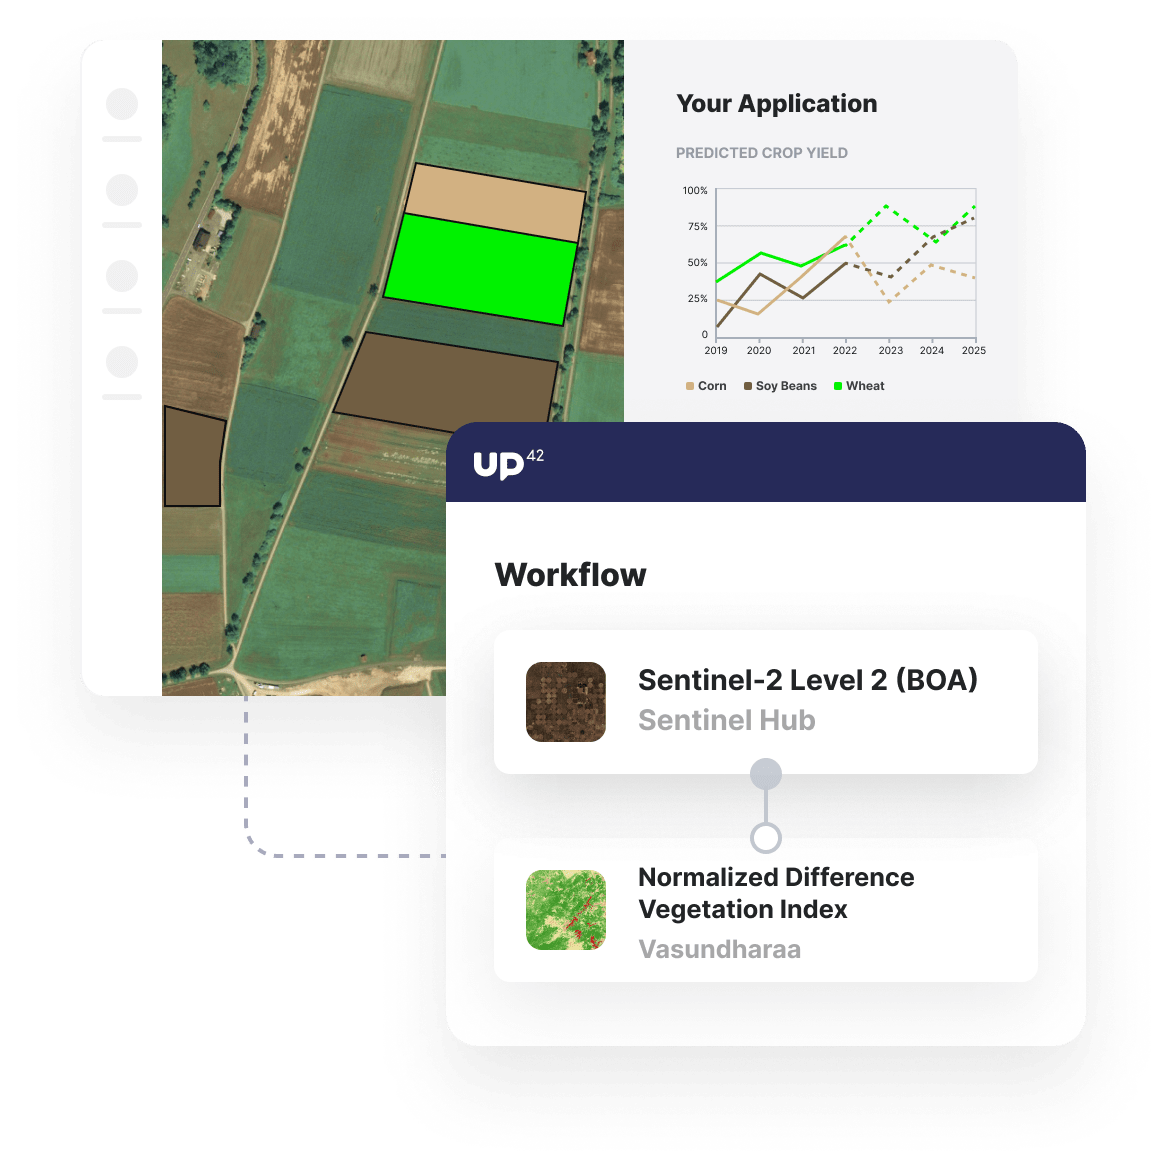
Access a vast library of very low-cost Sentinel-2 imagery from Sentinel Hub, with archive imagery dating back to 2016 to ensure reliable historical analysis.

Compute NDVI values for key AOIs

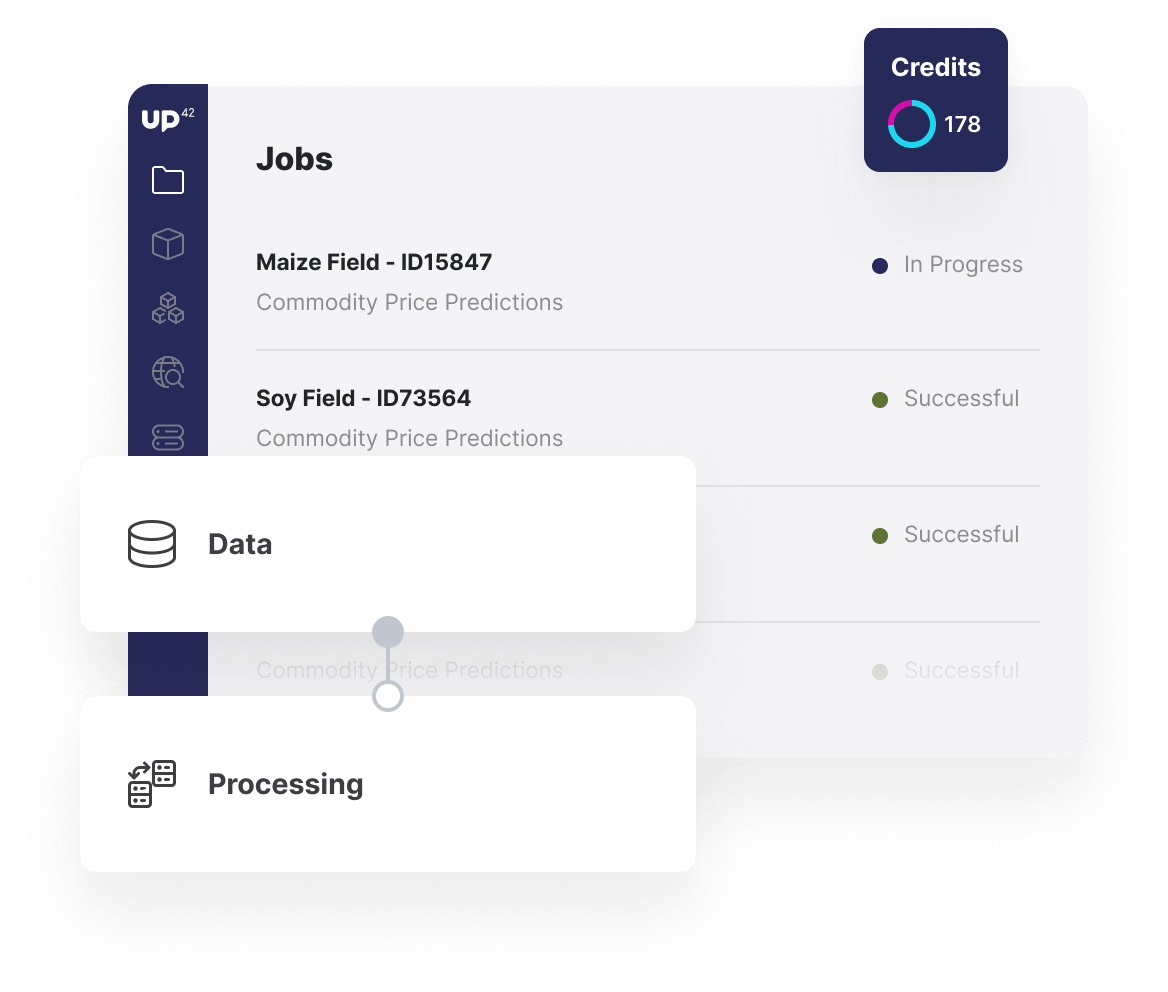
Run NDVI processing on your Sentinel-2 imagery focused on areas that have been identified as hotspots for the growth of agricultural commodities, such as wheat, corn, and soy.

Integrate and analyze outputs

Feed the NDVI analysis outputs into your own analytics tools to determine changes in NDVI year-on-year, predicted yields, and resulting commodity value predictions.
usecase-commodity-price
Land Management Vertical

Benefits

Benefits for you

  • Analyze vast areas of interest by accessing low-cost Sentinel-2 imagery.
  • Build up a robust time-series data set by repeating analysis whenever new imagery becomes available.
  • Leverage reliable and accurate NDVI algorithms and supplement analysis with other agricultural indices.

Benefits for your customers

  • Add a geospatial element to existing supply and demand analysis for key agricultural commodities.
  • Validate findings and improve predictions year-on-year as crop yields are made publicly available.
  • Avoid adding another software platform to your stack. Receive insights directly in existing tools via API.

The technical details

How can you use UP42 to build commodity price prediction solutions?

Data

High-quality satellite imagery

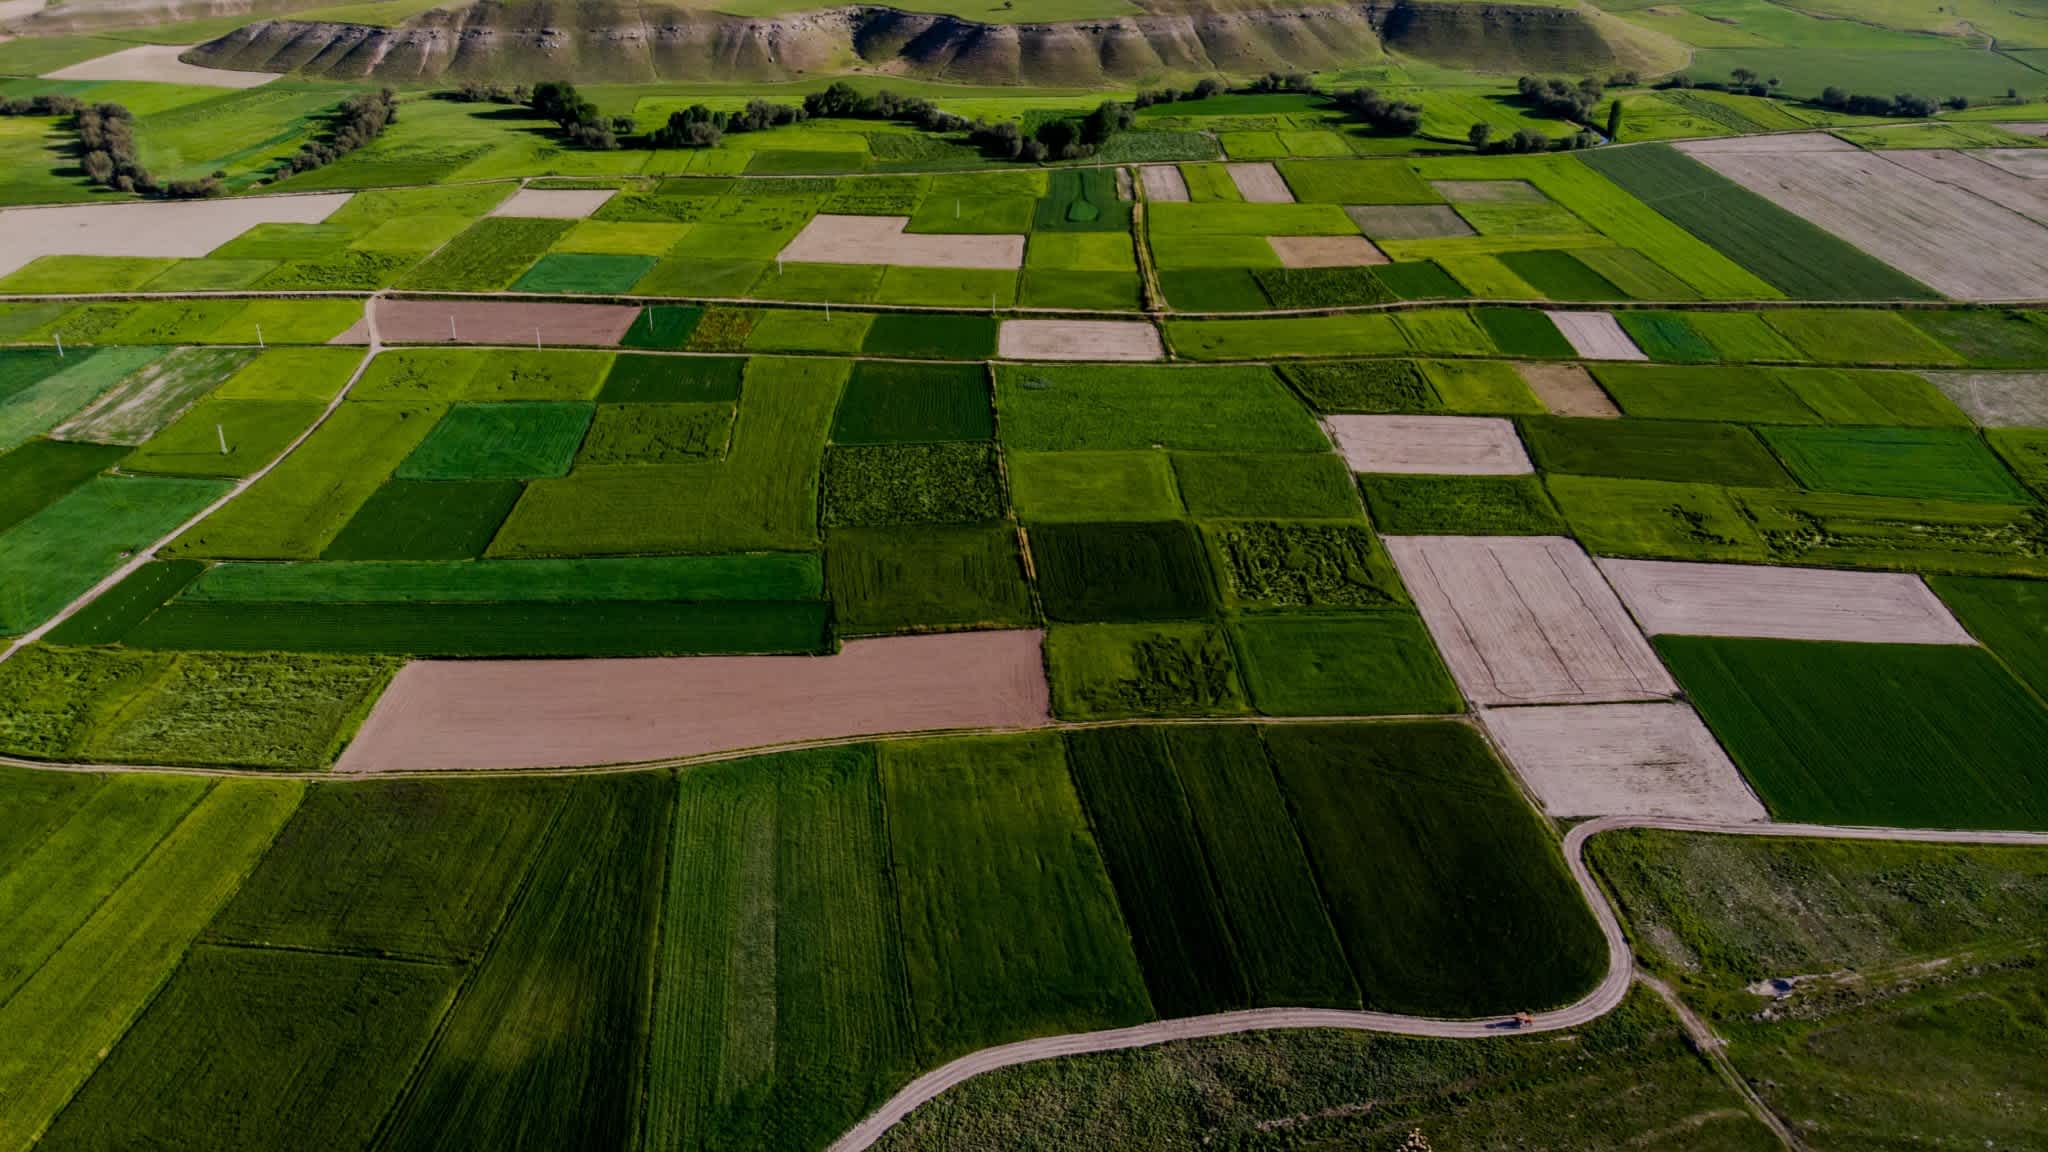
Access the latest Sentinel-2 imagery, alongside a library of 5 years of Sentinel-2 archive imagery. Identify low-cloud cover images for large areas that have been identified, using external data, as hotspots for the growth of key agricultural commodities, such as corn, wheat, and soy. These areas of interest should be sufficiently large to be used as reliable inputs for nationwide crop health indicators.

marketplace-commodity-price-predictions

Normalized difference vegetation index

Split the sample data sets by agricultural commodity, analyzing samples for each crop type separately. Determine NDVI values per pixel for each crop types' vast sample area by passing the Sentinel-2 imagery through one of the NDVI or similar agricultural indices' processing blocks available on the UP42 marketplace.

jobs-workflows-commodity-price-predictions

Integrate insights into analytics tools

Create powerful time-series data sets by integrating your NDVI analysis's outputs into the analytics tool of your choice. For example, you could access the data set in Jupyter Notebooks and plot changes in NDVI year-on-year, taking into account seasonality. These NDVI values can be correlated to crop yield in a given country to predict crop yield for the upcoming year. These predictions can be used as one input for the prediction of agricultural commodity prices.

custom-blocks-commodity-price-predictions

Automate and centralize analysis

Access all UP42-derived insights via API and access all platform functionality within the command line, leveraging the UP42 Python SDK. This enables UP42 to become one input in a broader, holistic analysis around commodity predictions. Whether you are integrating the outputs of an NDVI algorithm or accessing Pleiades, SPOT, or Sentinel-2 imagery directly, the Python SDK makes it easy and scalable.

Access our Python SDK

import up42
up42.authenticate(project_id="12345", project_api_key="12345")
project=up42.initialize_project()

workflow = project.create_workflow(name="Commodities", use_existing=True)
input_tasks=['oneatlas-pleiades-fullscene','pansharpen', 'ndvi']
workflow.add_workflow_tasks(input_tasks=input_tasks)
parameter = workflow.construct_parameters(
    geometry=[13.4466, 52.495598, 13.453016, 52.499216],
    geometry_operation="bbox",
    scene_ids="DS_PHR1A_202005061018418_FR1_PX_E013N52_0513_01179")

job = workflow.run_job(input_parameters=parameter, track_status=True)
job.download_results()

Explore the platform

Create an account to order, access, and analyze geospatial data.

Get started