Crop Monitoring Use Case

Use Case

Automatically monitor crop health

Leverage the broadest range of vegetative indexes available in the market to build holistic, reliable crop health monitoring solutions.

Intro

Automated crop monitoring with UP42

Increased climate variation is resulting in swings in crop health and yields. It is increasingly important to closely monitor crop health and take action when crop health diminishes to maximize yield. Readily available high-resolution data, algorithms, and infrastructure and making the process of automated crop monitoring more accessible than ever.

Overview

Satellite imagery, radar, and weather data

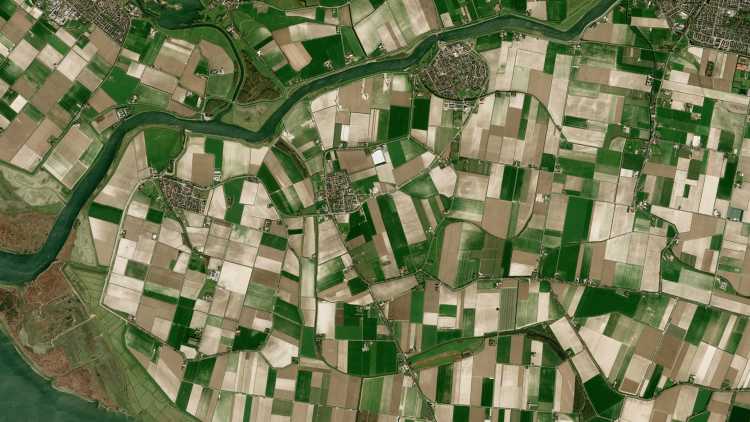
Get up-to-date archive or tasked satellite imagery to process and combine it with weather data, environmental conditions, digital elevation models, and more.

Monitor crop health and spot anomalies

Use a range of band math processing capabilities to measure crop health while tracking land-use changes, encroachment, and geohazard risks.

Combine info into a monitoring tool via API

Access all UP42 data and the outputs of analytics workflows in a single external crop monitoring tool via API, leveraging our Python SDK for ease of use.

usecase-crop-monitoring
Platform Image Land Management

Benefits

Benefits for you

  • Access all the different data sources you need in one system to make integration into your products effortless.
  • There's no need to start from scratch. Access a wide range of band math and machine-learning algorithms.
  • Scalable pricing that works whether you are building a solution for a single farm or a large industrial complex.
  • Ensure you have the data for precisely the period you need through our bespoke tasking service.

Benefits for your customers

  • Monitor farmland with confidence, knowing the insights are derived from industry-leading data providers.
  • Ensure a holistic solution to crop monitoring, taking into account all geospatial variables.
  • Access the insights in the tools of your choice, from QGIS to new tools to legacy crop monitoring software via API.

The technical details

How can you use UP42 to build crop monitoring solutions?

Data

Varied, industry-leading data sets

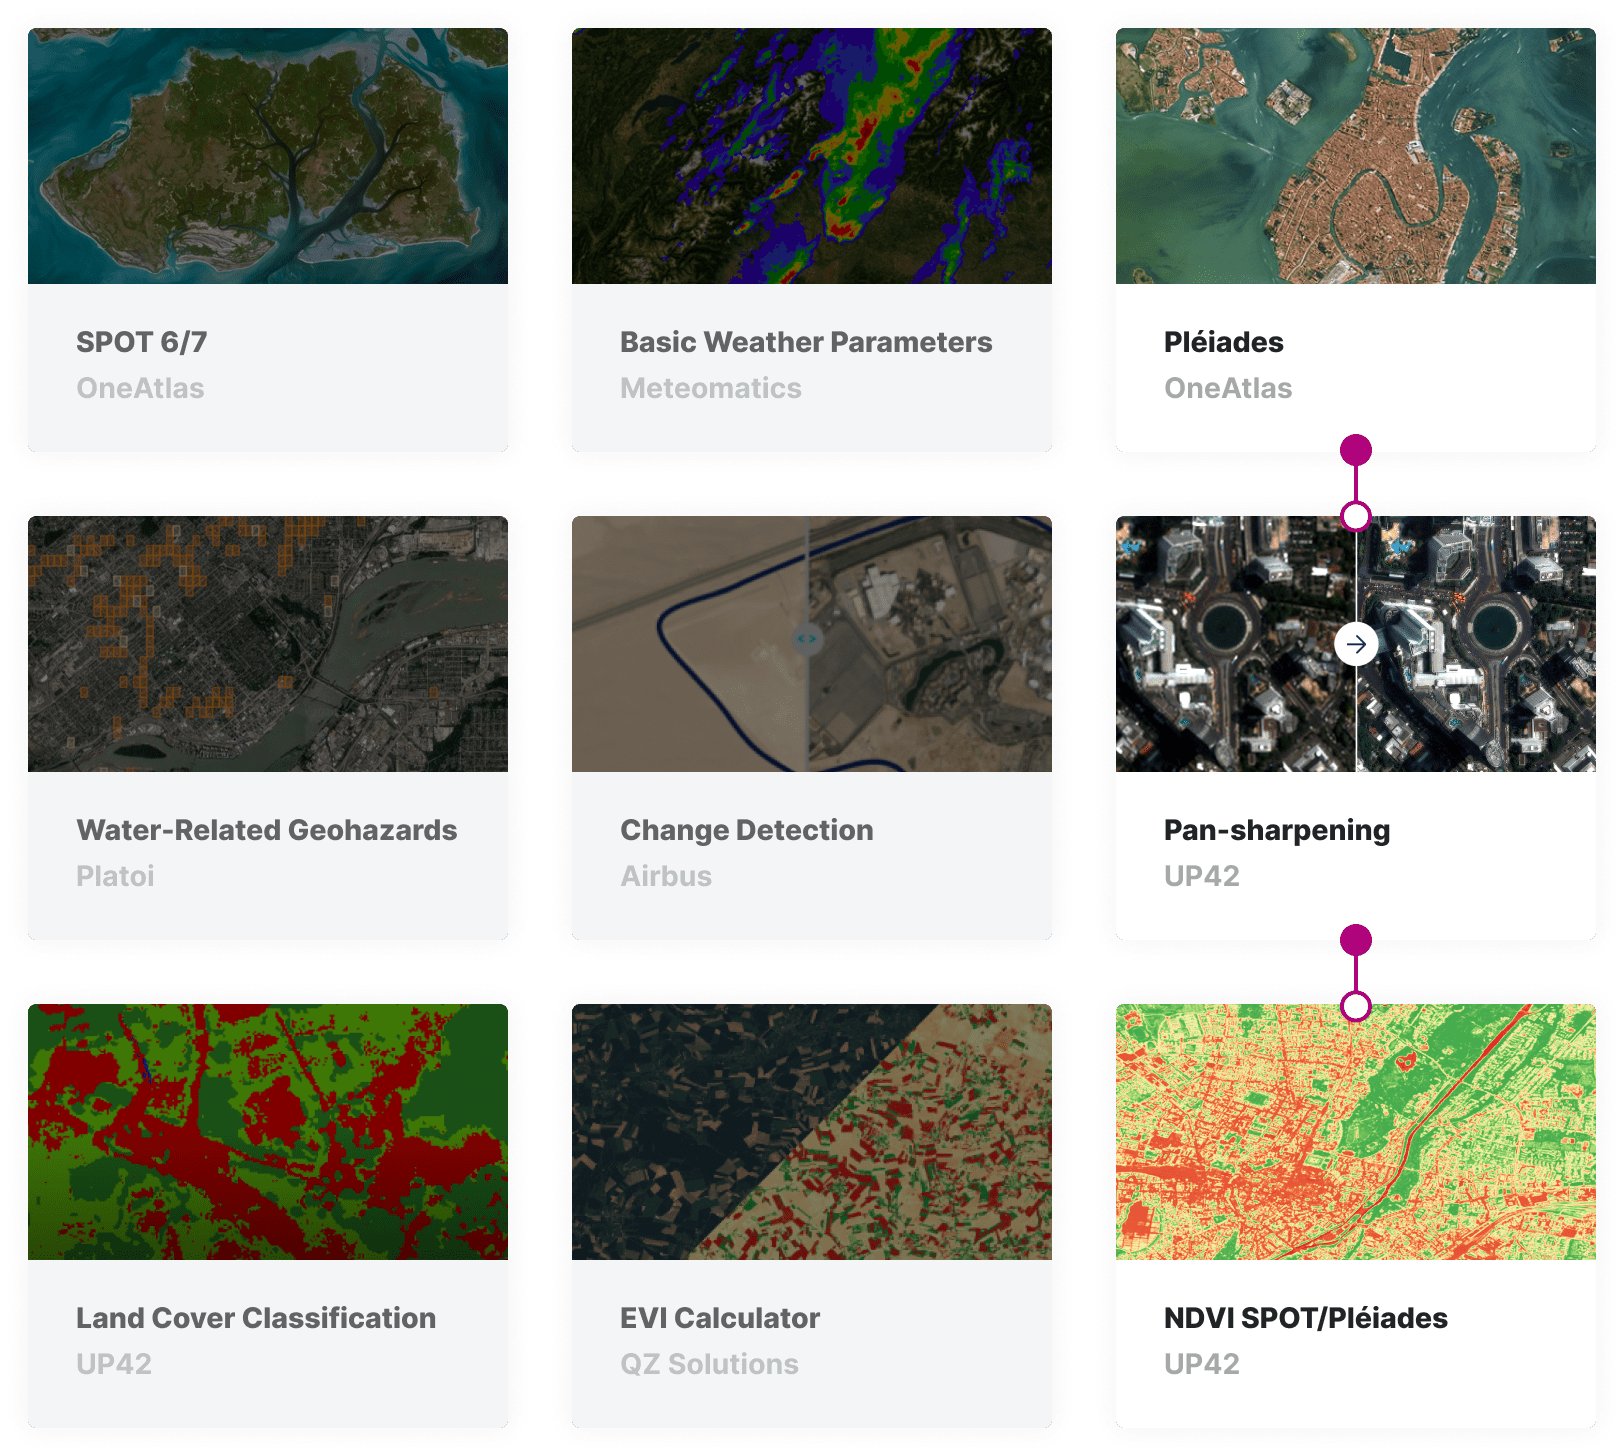
Access high-resolution digital elevation model data from Intermap, alongside Pleiades and SPOT imagery from Airbus. Supplement imagery data with data sets focused on water bodies and mapping information to build a holistic view of your area of interest. Specify your cloud cover, area of interest, and data range to get exactly the high-quality data you need.

marketplace-crop-monitoring

Band math

Easily visualize crop health

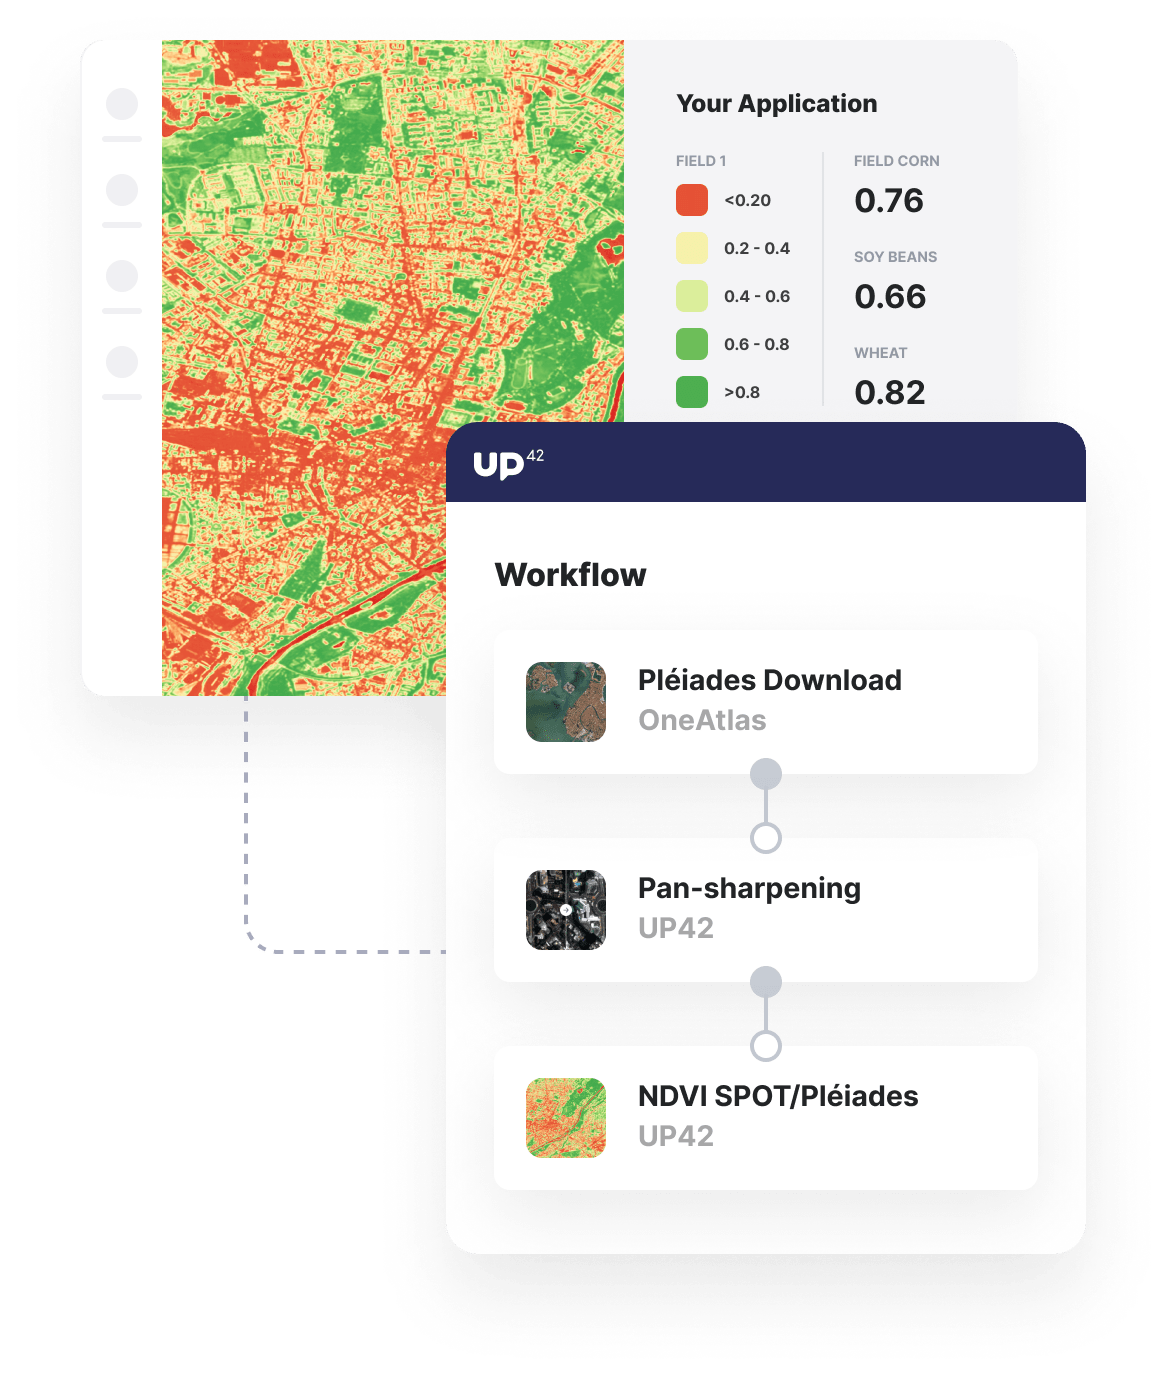
UP42 offers a wide range of band math processing blocks that provide accurate crop and soil health indicators. Leverage the band math block most relevant to your use case and AOI, from standard indices like NDVI and EVI to more advanced indices that take into account soil or canopy types SAVI or SIPI. Understand the health of the soil and the surrounding area by using capabilities such as MSI.

jobs-workflows-crop-monitoring

Analytics

Track change and risk factors

Use out-of-the-box change detection algorithms or advanced analytics that classify land coverage or detect settlements. For example, the Advanced Water-Related Geohazards Predictor block can predict flooding or water body expansion that could impact farmland. Algorithms such as this augment the snapshot in time that band math processing blocks provide and give both a past assessment and future outlook for crops.

custom-blocks-crop-monitoring

API

Combine data, automate your analysis

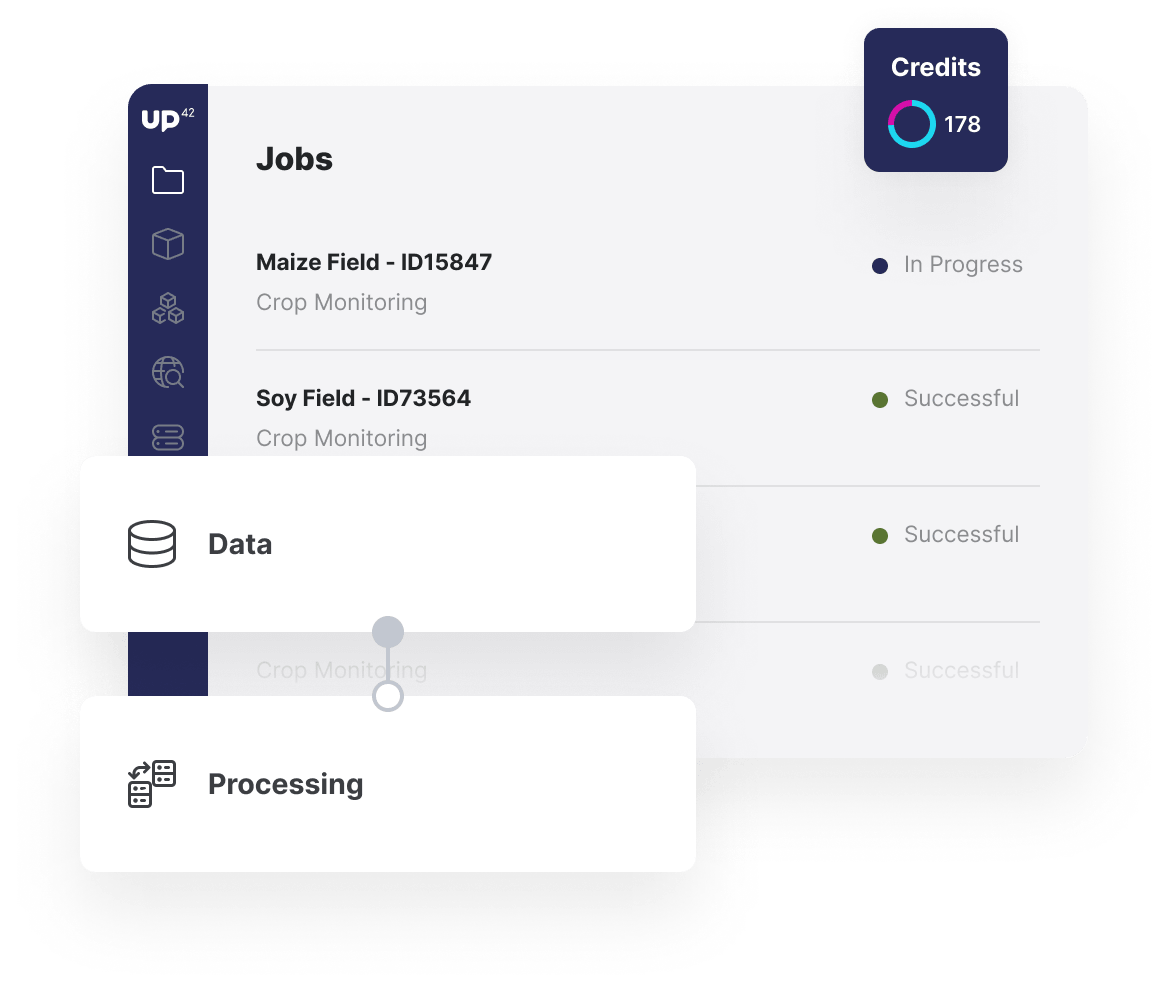
Through the UP42, and supported by the Python SDK, it is easier than ever to integrate the outputs of UP42 workflows into your end-users' products. Trigger your analysis through the Python SDK and access your outputs via download or integrated into your products or cloud storage. For larger AOIs, you can seamlessly scale your analysis by parallelizing your jobs.

Access our Python SDK

import up42
up42.authenticate(project_id="12345", project_api_key="12345")
project=up42.initialize_project()

workflow = project.create_workflow(name="Crop Monitoring", use_existing=True)
input_tasks=['oneatlas-pleiades-fullscene','pansharpen', 'ndvi']
workflow.add_workflow_tasks(input_tasks=input_tasks)
parameter = workflow.construct_parameters(
    geometry=[13.4466, 52.495598, 13.453016, 52.499216],
    geometry_operation="bbox",
    scene_ids="DS_PHR1A_202005061018418_FR1_PX_E013N52_0513_01179")

job = workflow.run_job(input_parameters=parameter, track_status=True)
job.download_results()

Explore the platform

Create an account to order, access, and analyze geospatial data.

Get started