Environmental Protection
Protect the natural environment by identifying areas and quantifying the loss where excessive or illegal deforestation has occurred.
Assess environmental risks or regulatory infringement by mapping historical deforestation and monitoring changes in deforestation maps over time.
Intro
The economic, social, and environmental impacts of deforestation can be drastic. However, due to the vast areas and inaccessibility of rainforest, monitoring deforestation is a huge challenge. Satellite monitoring enables the true extent of deforestation to be understood through regular, automated, and accurate deforestation mapping.
Overview
High-resolution satellite imagery
Access a vast library of archive Pleiades imagery and task a satellite at regular intervals, guaranteeing high-quality capture at a low cloud coverage.
Deforestation mapping algorithms
Assess the area of deforestation from one satellite image to another to get ongoing insights into the level of deforestation in your area of interest.
Automate and integrate insights
Use our Python SDK to automate and scale analysis, parallelizing jobs for large AOIs and seamlessly integrating insights into your own tools via API.
Protect the natural environment by identifying areas and quantifying the loss where excessive or illegal deforestation has occurred.
Understand and analyze land-use changes in vast areas, identifying where the forest has made way for farmland.
The technical details
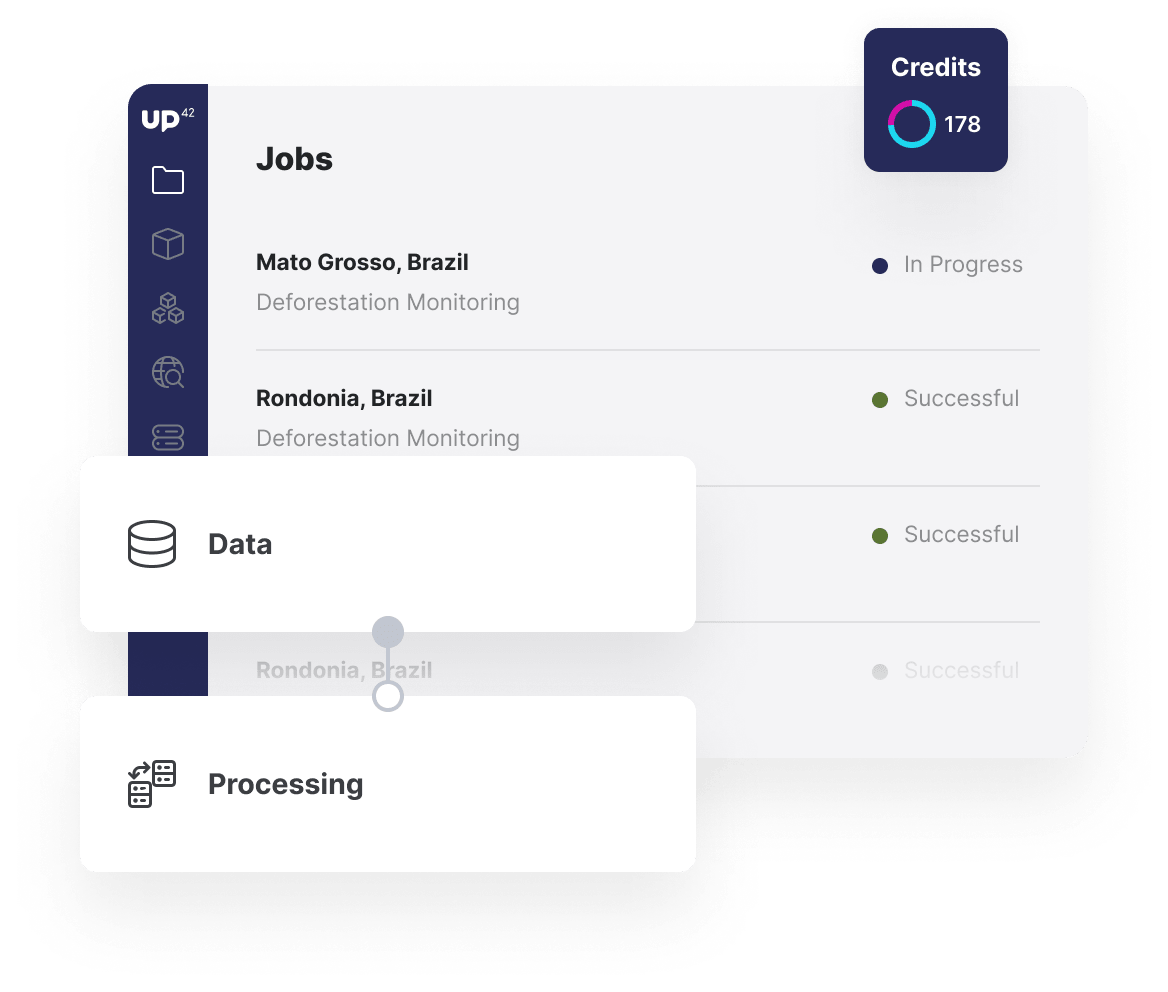
Data
High-quality satellite imagery
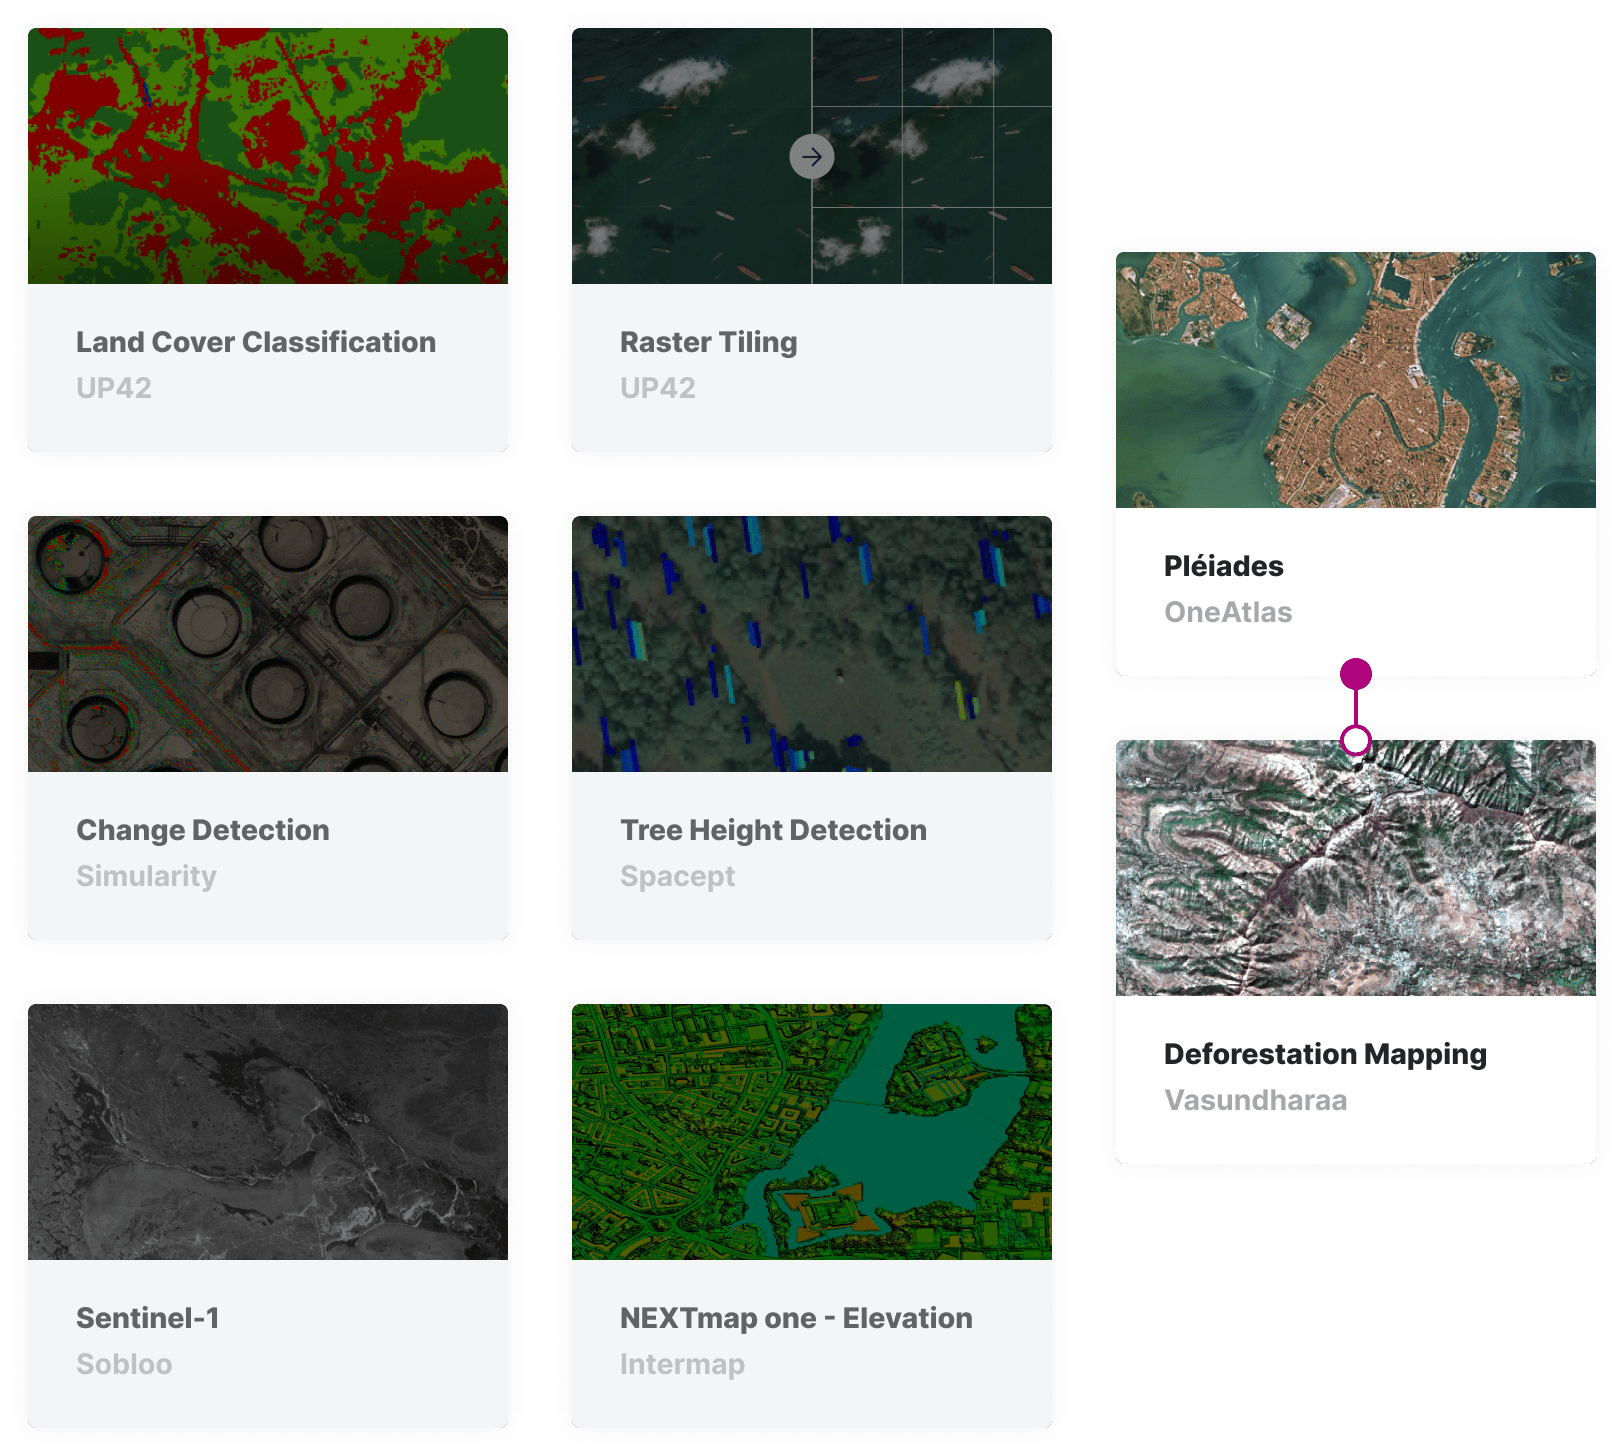
Stream high-resolution Pleiades imagery into your analytics workflow in UP42. For historical deforestation mapping, you can access UP42's vast library of archive imagery, paying only for your AOI and picking images with low cloud coverage. For guaranteed regular imagery for your AOI, you can task a satellite with UP42 to be used in your UP42 workflow.
Processing
Map deforestation over time
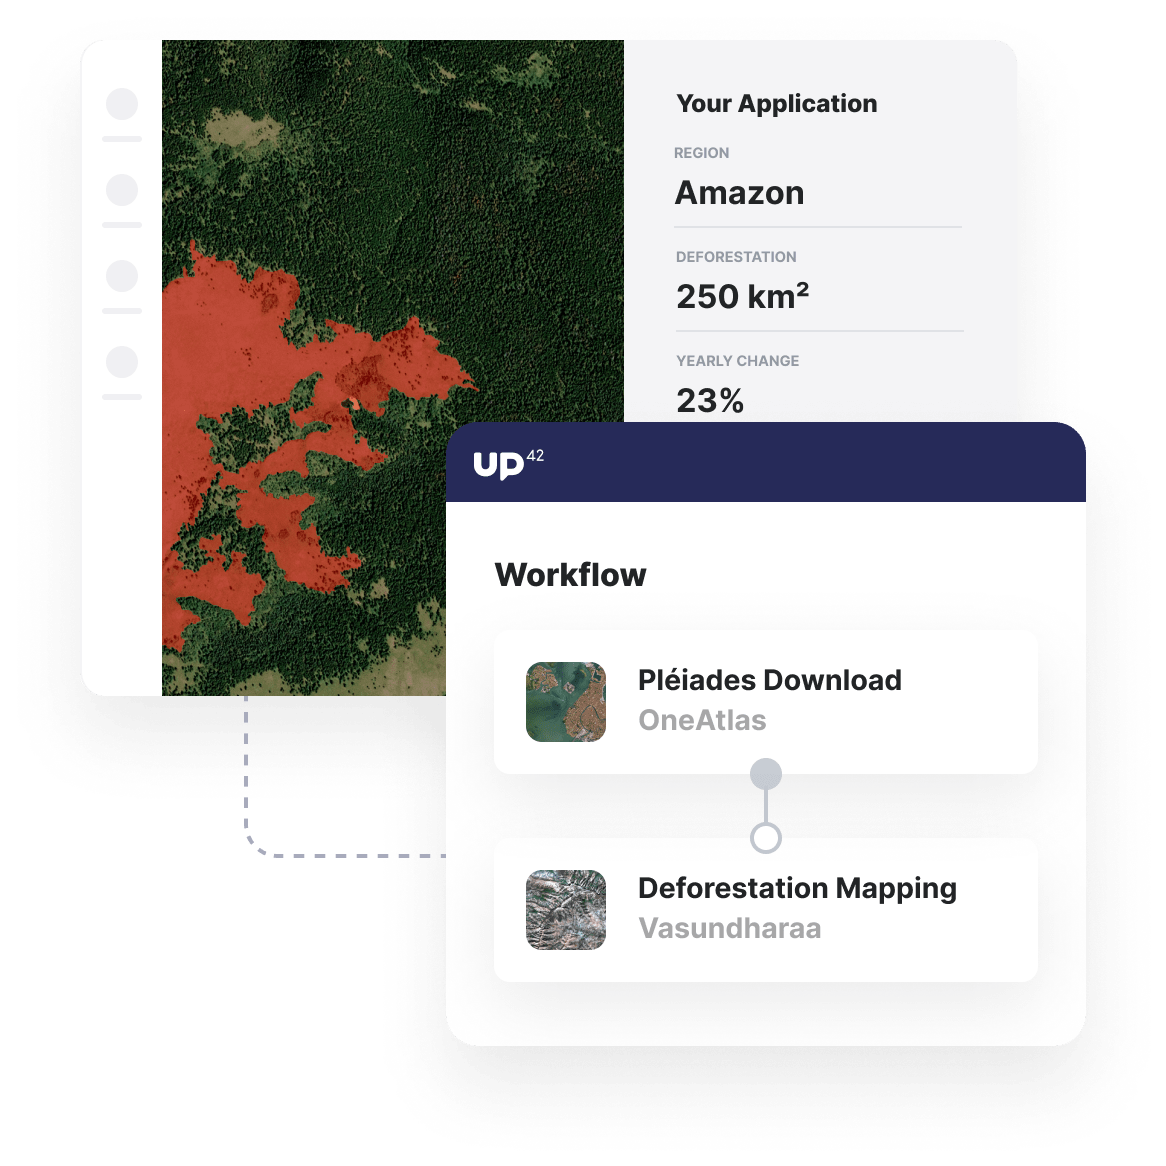
With an out-of-the-box deforestation mapping processing block from Vasundharaa, you can quickly and easily map the change in forest area between two Pleiades images using temporal analysis. This deforestation mapping block is also compatible with Sentinel-2, Landsat-8, and SPOT 6/7 imagery.
Insights
Download or integrate outputs
The deforestation mapping block generates a georeferenced binary image where white pixels represent deforested areas. In addition to the binary image, the block generates a deforestation heatmap. These inputs can be easily downloaded, fed directly into your Google Cloud or AWS storage, or integrated via API into your products or your customers' solutions.
API & Python SDK
Automate your analysis
Build and automate analytics workflows leveraging UP42's infrastructure but working in Jupyter Notebooks or other command-line tools. With our Python SDK, you can access all the functionality of the UP42 platform within the command line, enabling UP42 to work seamlessly within your existing processes, interacting with your regular analytics workflows, tools, and libraries.
import up42
up42.authenticate(project_id="12345", project_api_key="12345")
project=up42.initialize_project()
workflow = project.create_workflow(name="Deforestation", use_existing=True)
input_tasks=['oneatlas-pleiades-aoiclipped','deforestation']
workflow.add_workflow_tasks(input_tasks=input_tasks)
parameter = workflow.construct_parameters(
geometry=[13.41686, 52.51167, 13.422503, 52.514706],
geometry_operation="intersects",
start_date="2020-01-01",
end_date="2020-10-14",
limit=2)
job = workflow.run_job(input_parameters=parameter, track_status=True)
job.download_results()
Ready to get started? Create an account in seconds and we'll even give you 10,000 credits to get your first insights.