Flood Risk Analysis > Benefits Image

Use Case

Analyze and Predict Flood Risk

Leverage optical and radar imagery and analytics to map historical flooding and predict water-related geohazards, such as flooding and exposure to water bodies.

Intro

Automate flood risk analysis with UP42

With the acceleration of climate change, flooding is becoming more frequent. Increasingly frequent and severe flooding around the world has an untold impact on people's lives and livelihoods. Geospatial data and analytics can be used to map flooding and forecast risks, enabling support and mitigation strategies to be effectively deployed.

Overview

High-resolution optical and radar imagery

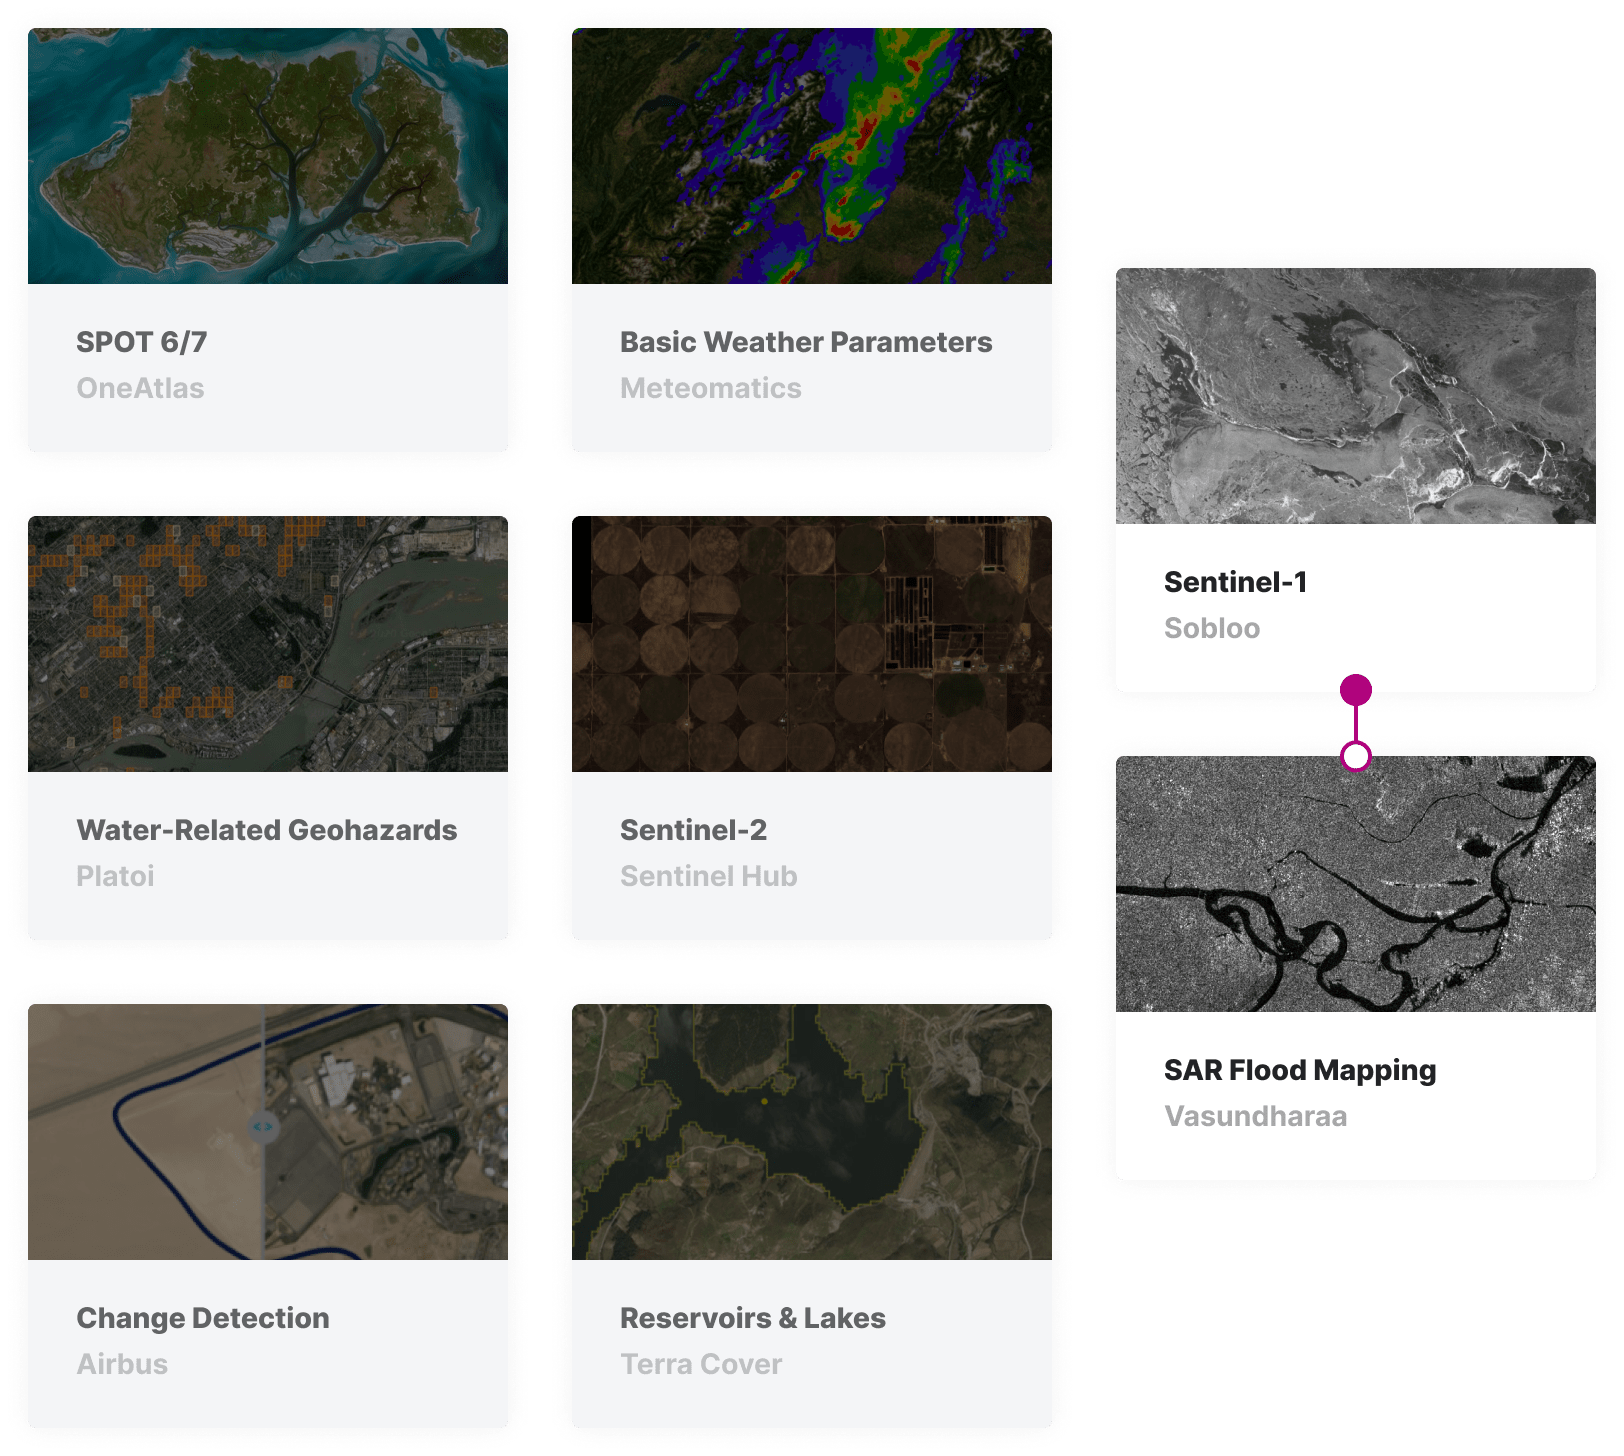
Access high-resolution Sentinel-2 optical and Sentinel-1 radar imagery for vast areas of interest. Augment analysis with 1000 historical and forecasted weather parameters.

Respond to floods effectively

Map floods using Sentinel-1 radar imagery to analyze the area affected by flooding to target support to the right areas.

Predict water-related geohazards

Use out-of-the-box machine-learning algorithms processing Sentinel-2 data to predict flooding or exposure to water bodies for your areas of interest.
usecase-flood-risk
Flood Risk Analysis > Hero Image

Benefits

Benefits for you

  • Save costs by purchasing only the data and processing the algorithm covering exactly your customer's AOI.
  • Save time by utilizing our APIs to automate your analytics workflows fully.
  • Avoid costly and time-consuming setup by building on our tried-and-tested infrastructure.
  • Supplement archive data with the latest data, utilizing our bespoke tasking service.

Benefits for your customers

  • Get timely insights to proactively respond to flood risk, enabling you to target mitigation strategies effectively.
  • Ensure you have a full picture of flood risk, utilizing various high-quality data sets and analytics.
  • Avoid adding another software platform to your stack. Receive insights directly in existing tools via API.

The technical details

How can you use UP42 to build flood risk analysis solutions?

Data

High-quality satellite imagery

Access the latest Sentinel-1 and Sentinel-2 imagery, searching via our catalog search feature that enables you to search based on cloud coverage and date range. Supplement the Sentinel-2 imagery with a range of weather data parameters that can provide historical and forecast information on extreme weather risks.

marketplace-flood-risk

Historical analysis

Apply algorithms to vast archive data

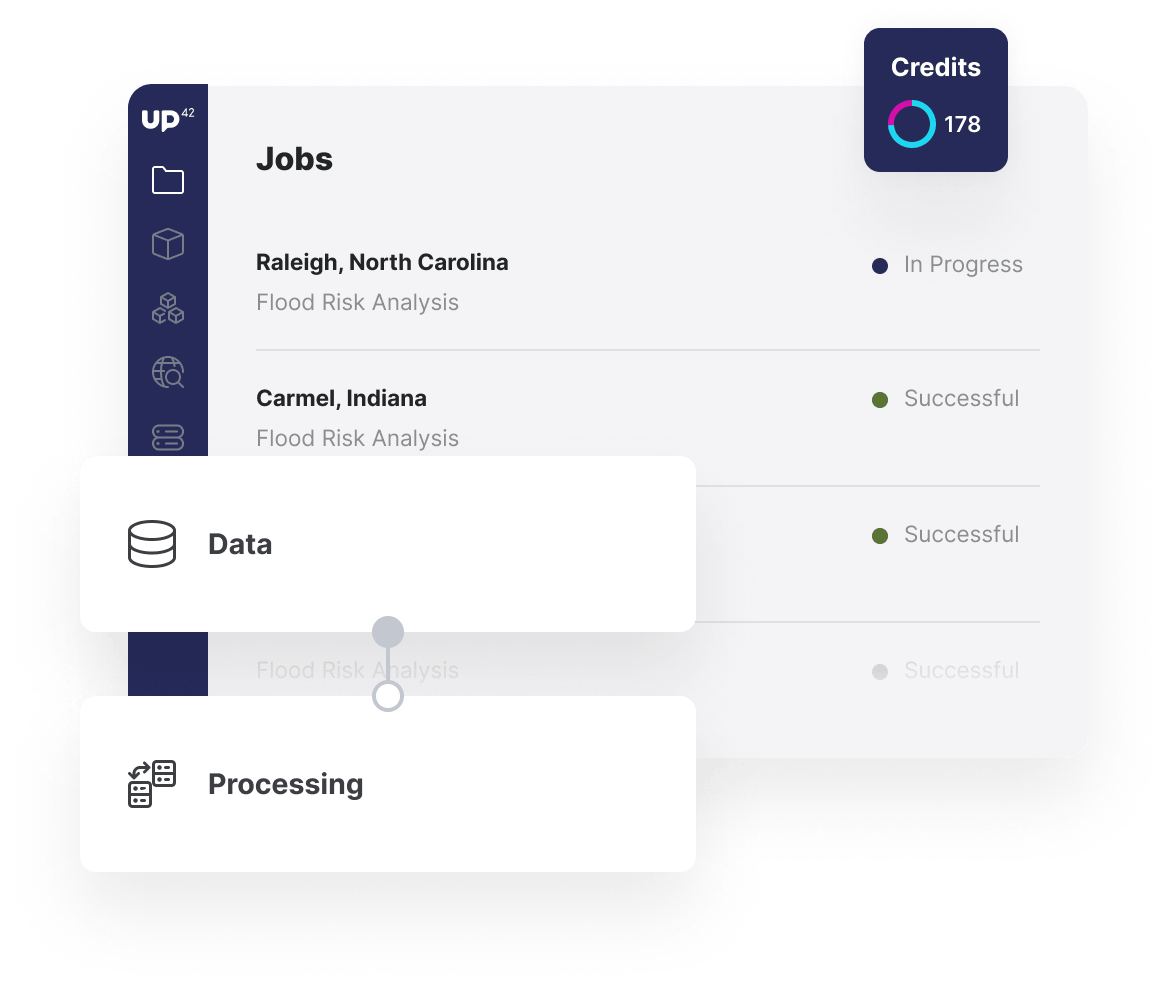
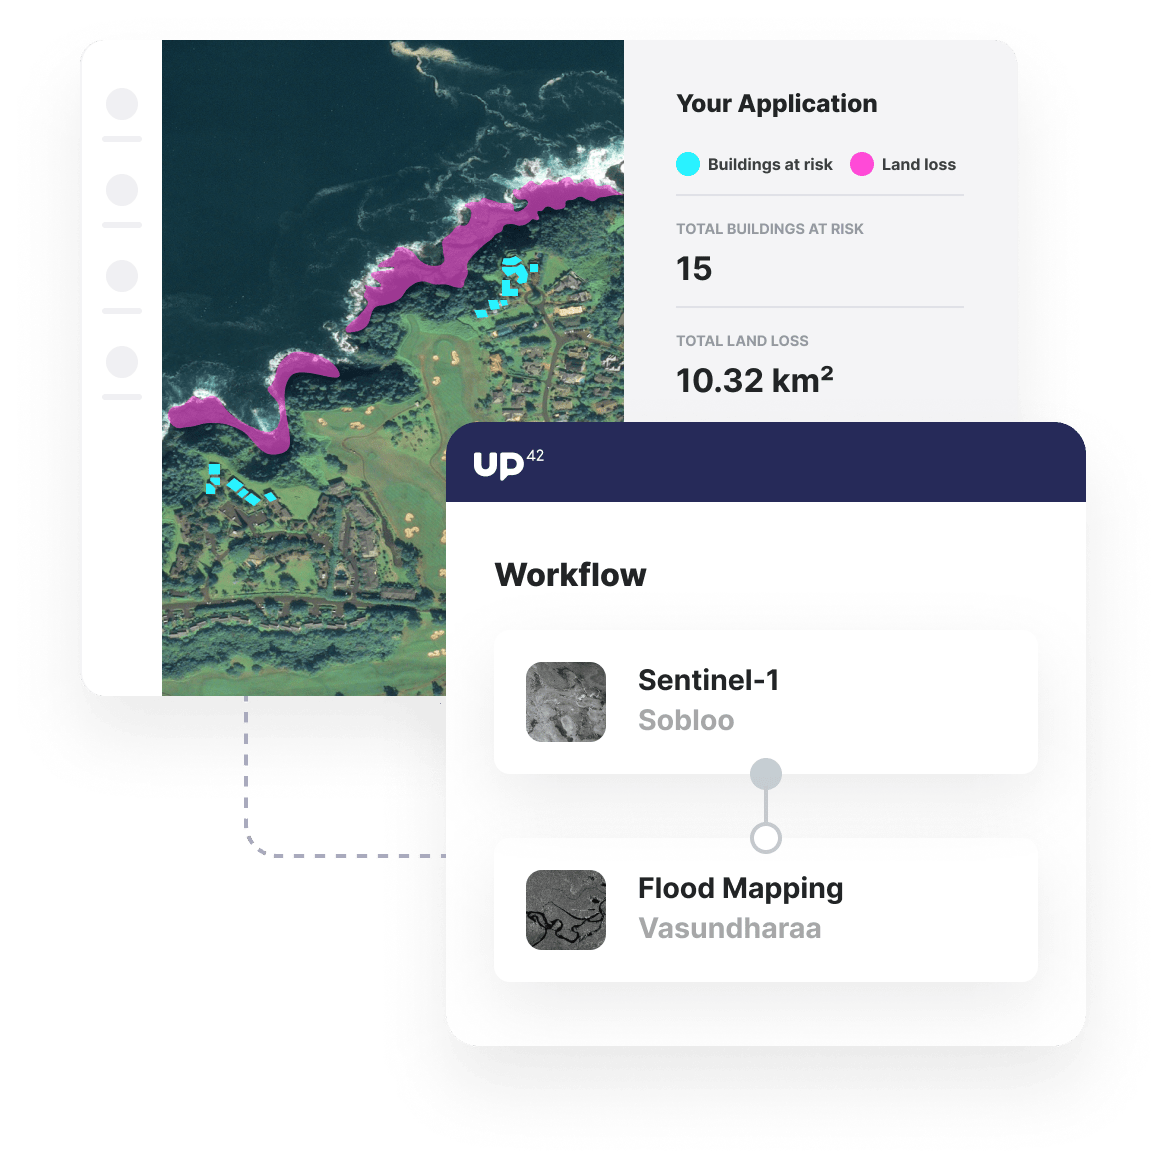
Map flooding by processing Sentinel-1 SAR data before and after a flood occurs to understand where support should be deployed. Additionally, process Meteomatics' weather data to detect areas that are prone to extreme fluctuations in wind speed, rainfall levels, and temperature that all indicate susceptibility to extreme weather events.

jobs-workflows-flood-risk

Predictions

Predict water-related geohazards

Use Platoi's Advanced Water-Related Geohazards processing block on Sentinel-2 imagery to predict areas at risk of flooding and exposure to water bodies. With predictions up to six months in advance, this block can provide adequate time to respond with mitigation strategies to limit the risk to human lives, infrastructure, and property.

custom-blocks-flood-risk

API

Combine and integrate your insights

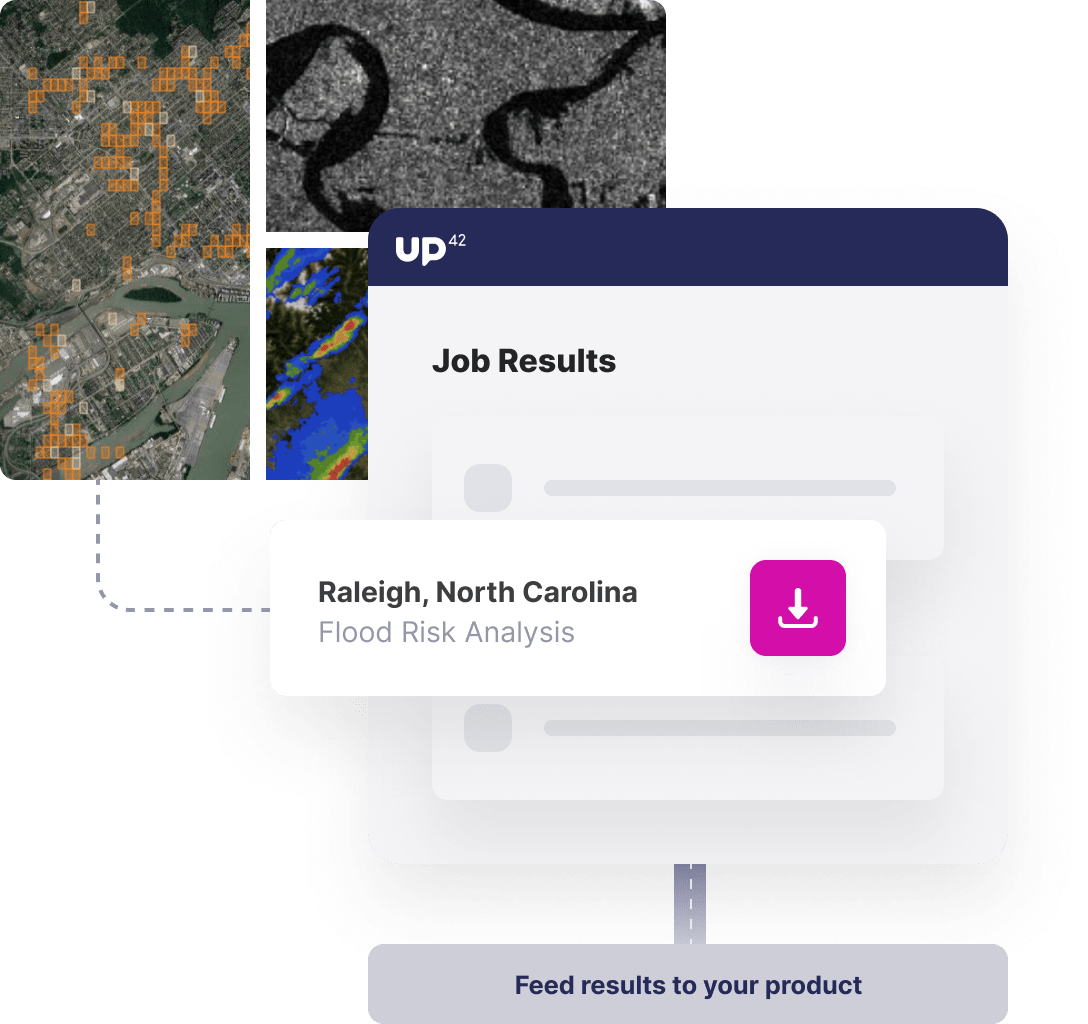
These ranging insights from the identification of extreme weather to historical flood maps to water-related geohazard predictions can be easily integrated into geospatial products via API or downloaded and provided directly to the end-user. In addition to the ease of integration, the API and Python SDK enable this analysis to run regularly and feed into legacy tools or alert systems.

Access our Python SDK

import up42
up42.authenticate(project_id="12345", project_api_key="12345")
project=up42.initialize_project()

workflow = project.create_workflow(name="Portfolio", use_existing=True)
input_tasks=['sobloo-s1-grd-aoiclipped', 'flood_mapping']
workflow.add_workflow_tasks(input_tasks=input_tasks)
parameter = workflow.construct_parameters(
    geometry=[13.465129, 52.502325, 13.466738, 52.503546],
    geometry_operation="intersects",
    start_date="2020-01-01",
    end_date="2020-10-14",
    limit=2)

job = workflow.run_job(input_parameters=parameter, track_status=True)
job.download_results()

Explore the platform

Create an account to order, access, and analyze geospatial data.

Get started