Port Optimization > Hero Image

Use Case

Optimize Port Activity

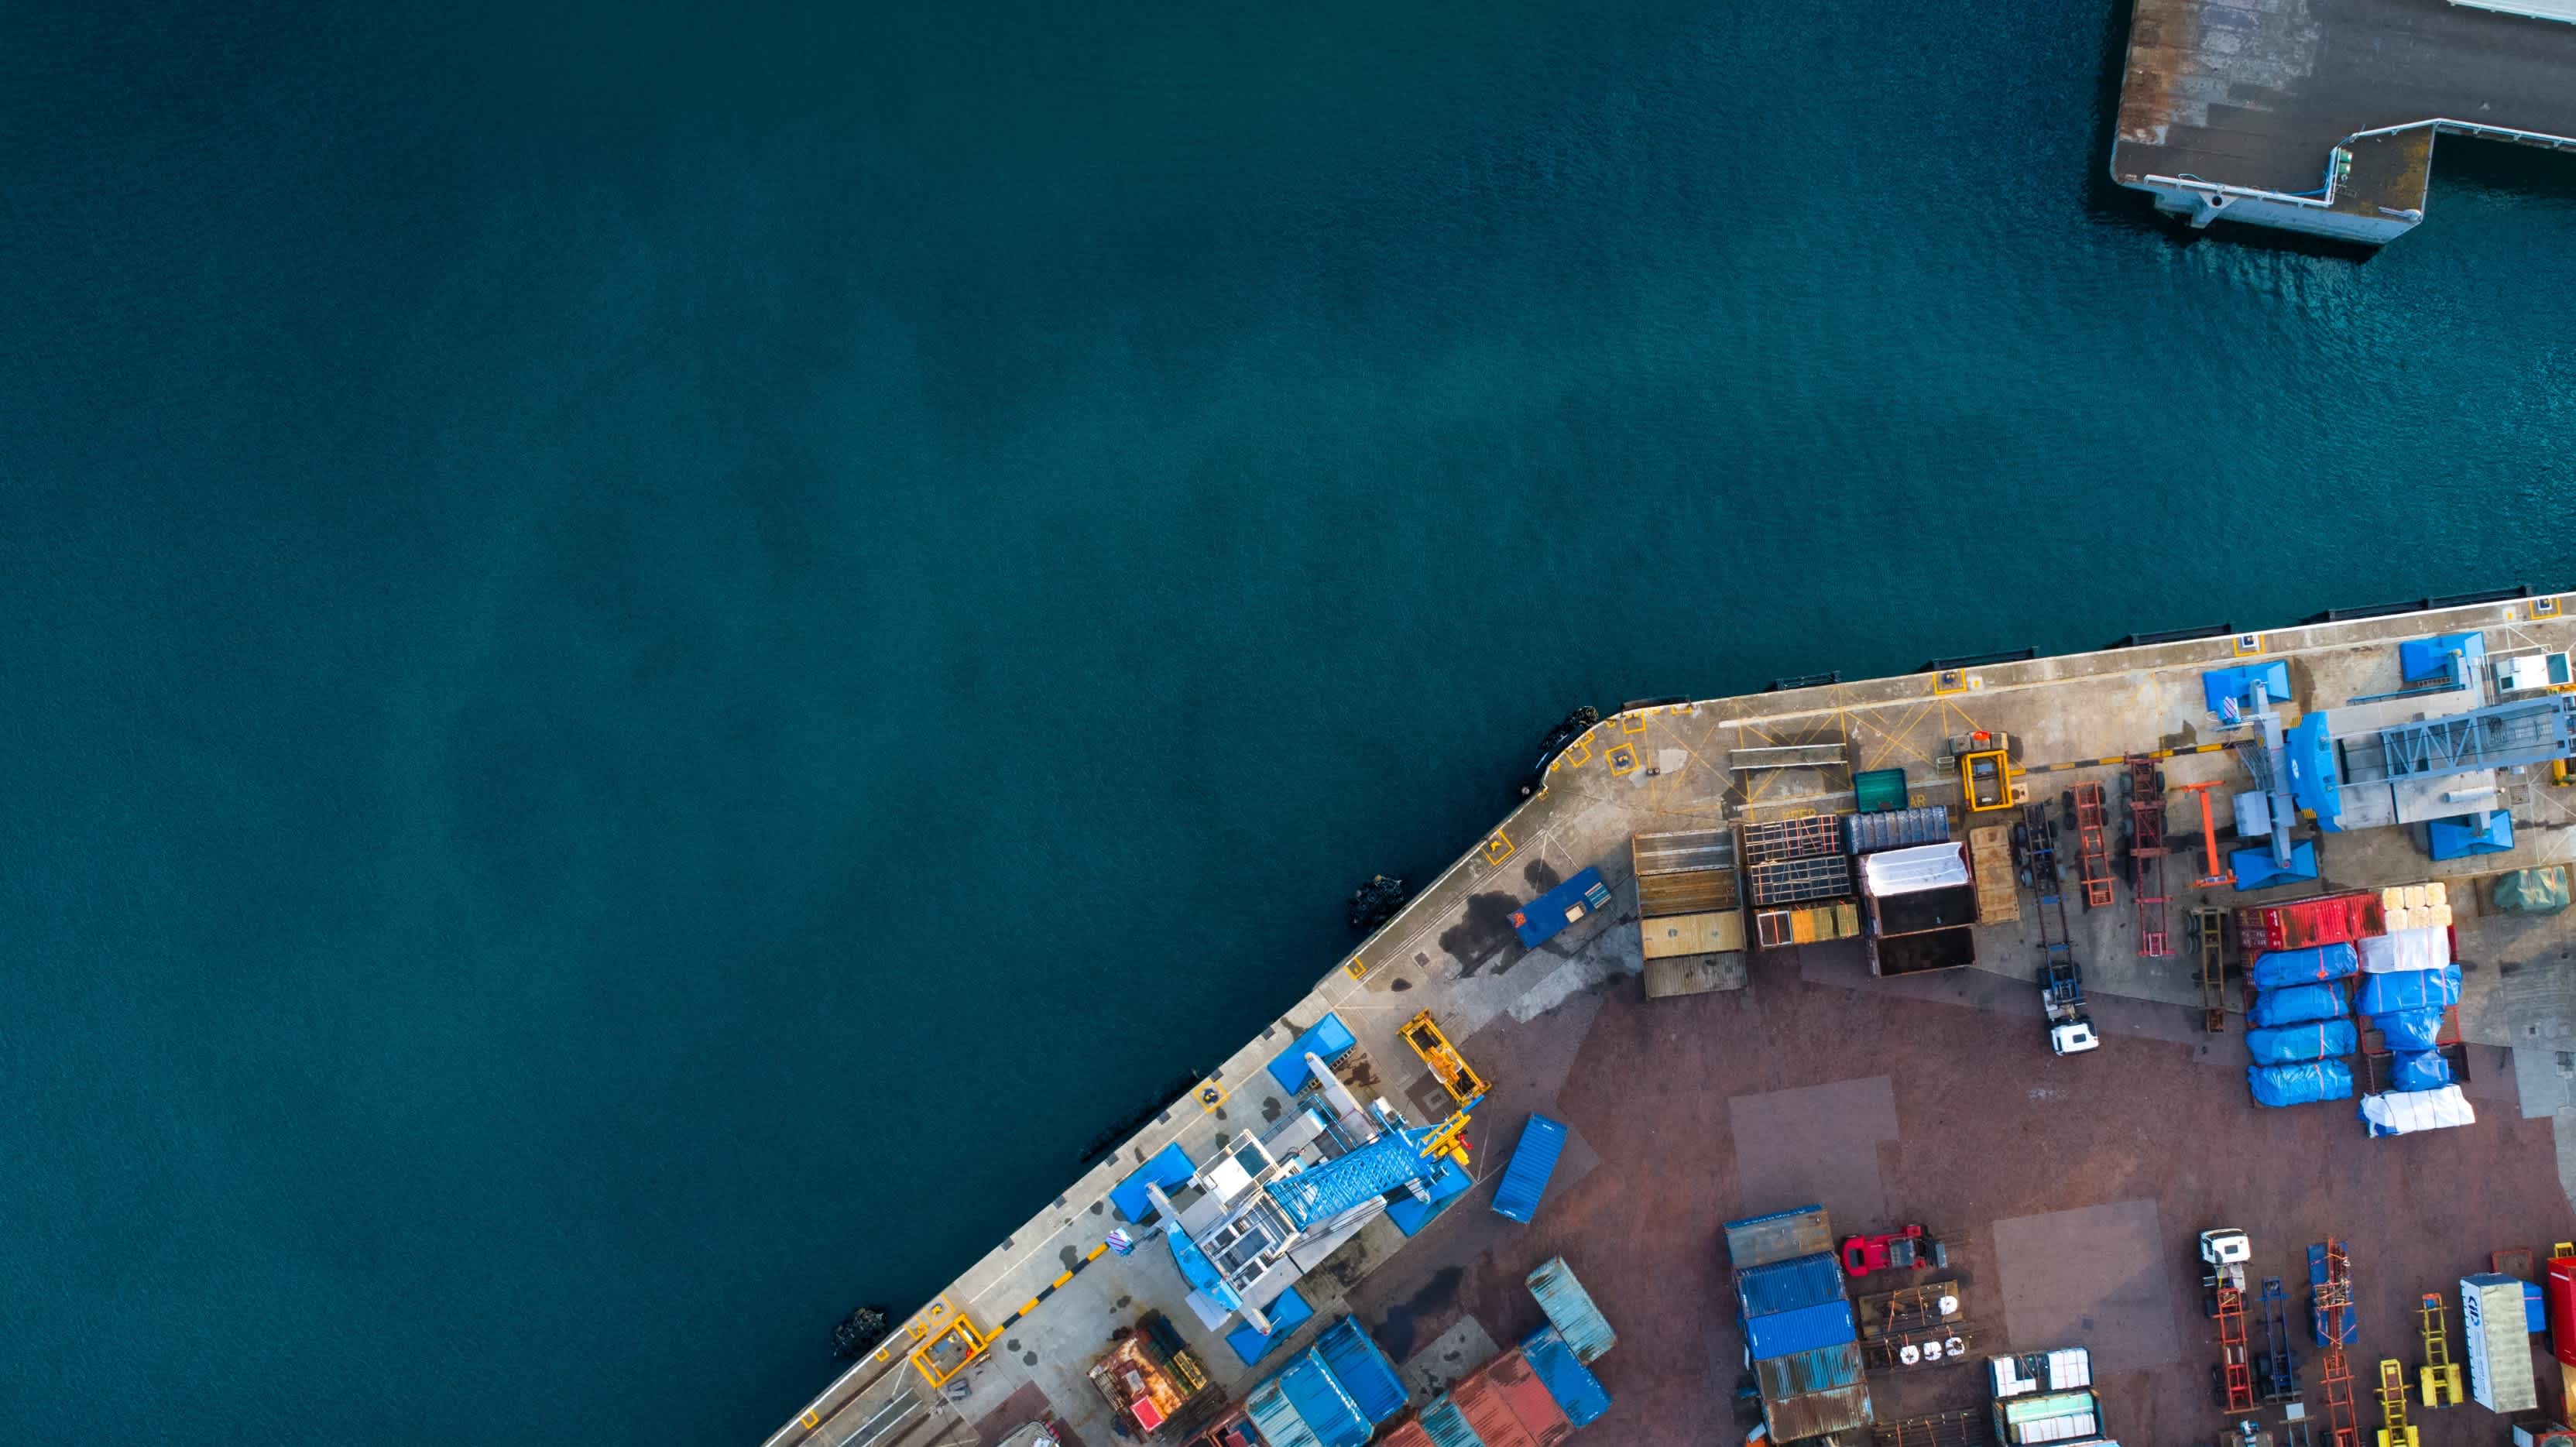
Automatically monitor, predict, and optimize maritime and logistics activity in and around ports, using satellite imagery and machine learning.

Intro

Build port optimization solutions with UP42

International ports are hubs of maritime activity. Hundreds or thousands of vessels come and go every day, each with individual vessel sizes, docking requirements, cargo types, and more. Geospatial data, coupled with advanced analytics, can enable port owners to increase access to crucial information, understand the activity, and make predictions.

Overview

High-resolution satellite imagery

Access a vast archive of SPOT 6/7 and Pleiades imagery or commission high-resolution satellites to take regular images of ports and surrounding areas.

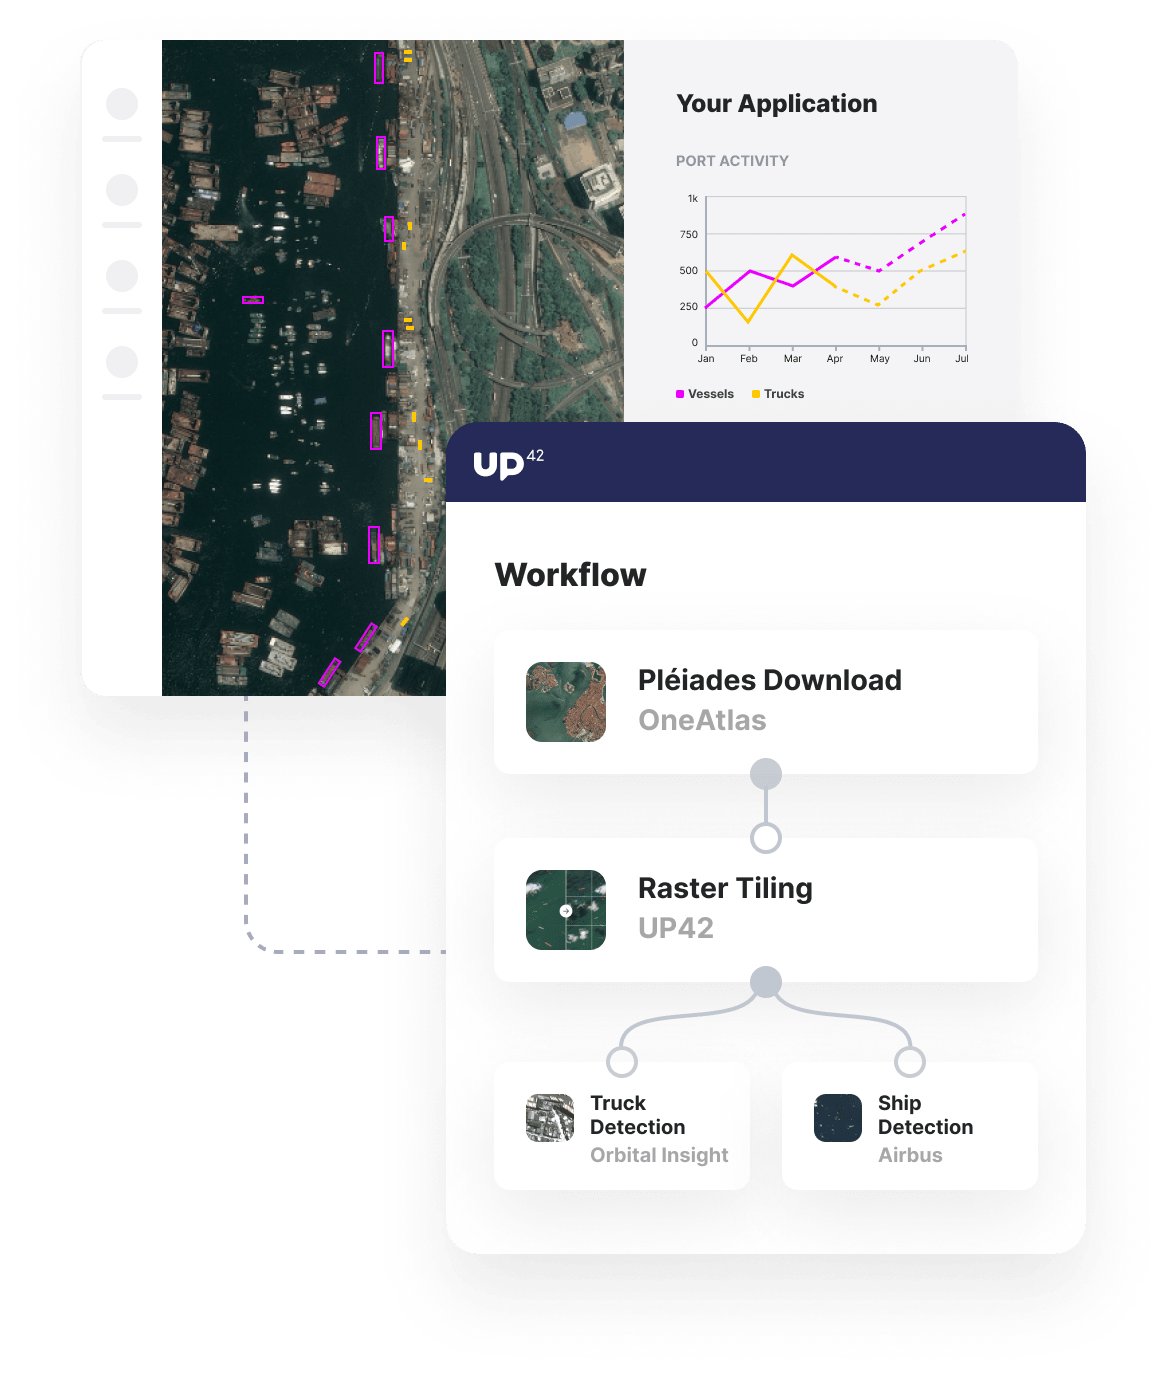
Ship and truck detection

Monitor maritime and trucking activity around the port to track and predict the incoming and outgoing ship and vehicle traffic.

Your own prediction algorithms

Combine detection algorithms with UP42's Count Objects block to create time-series data that can be leveraged to feed your own forecasts for maritime and land traffic activity.
usecase-port-optimization
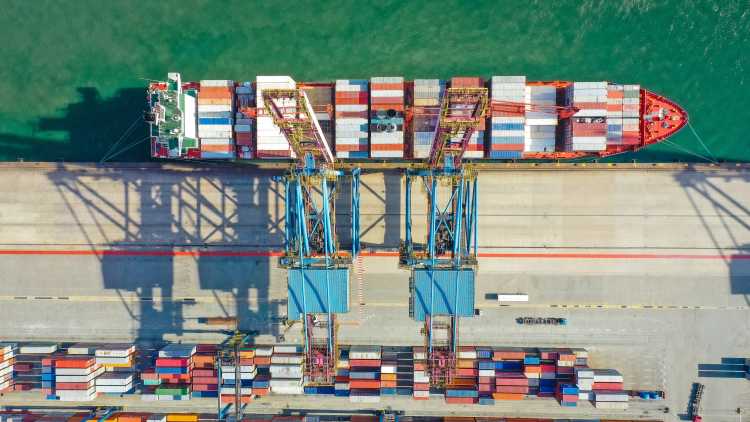
Vessel at Port

Benefits

Benefits for you

  • Combine historical satellite imagery with regularly-tasked satellite imagery.
  • Use out-of-the-box detection algorithms for both maritime and land vehicles.
  • Augment out-of-the-box algorithms with your own algorithms to create a single analytics workflow on UP42.
  • Automate your analysis and easily integrate the outputs in external tools via API.

Benefits for your customers

  • Receive regularly-updated insights via API, delivered directly to the tools of your choice.
  • Avoid manual interpretation of satellite imagery and time-series data, as machine learning does the heavy lifting.
  • Receive longer-term machine-learning-backed predictions to enable better port planning and minimize vessel traffic.

The technical details

How can you use UP42 to build port optimization solutions?

High-resolution satellite imagery

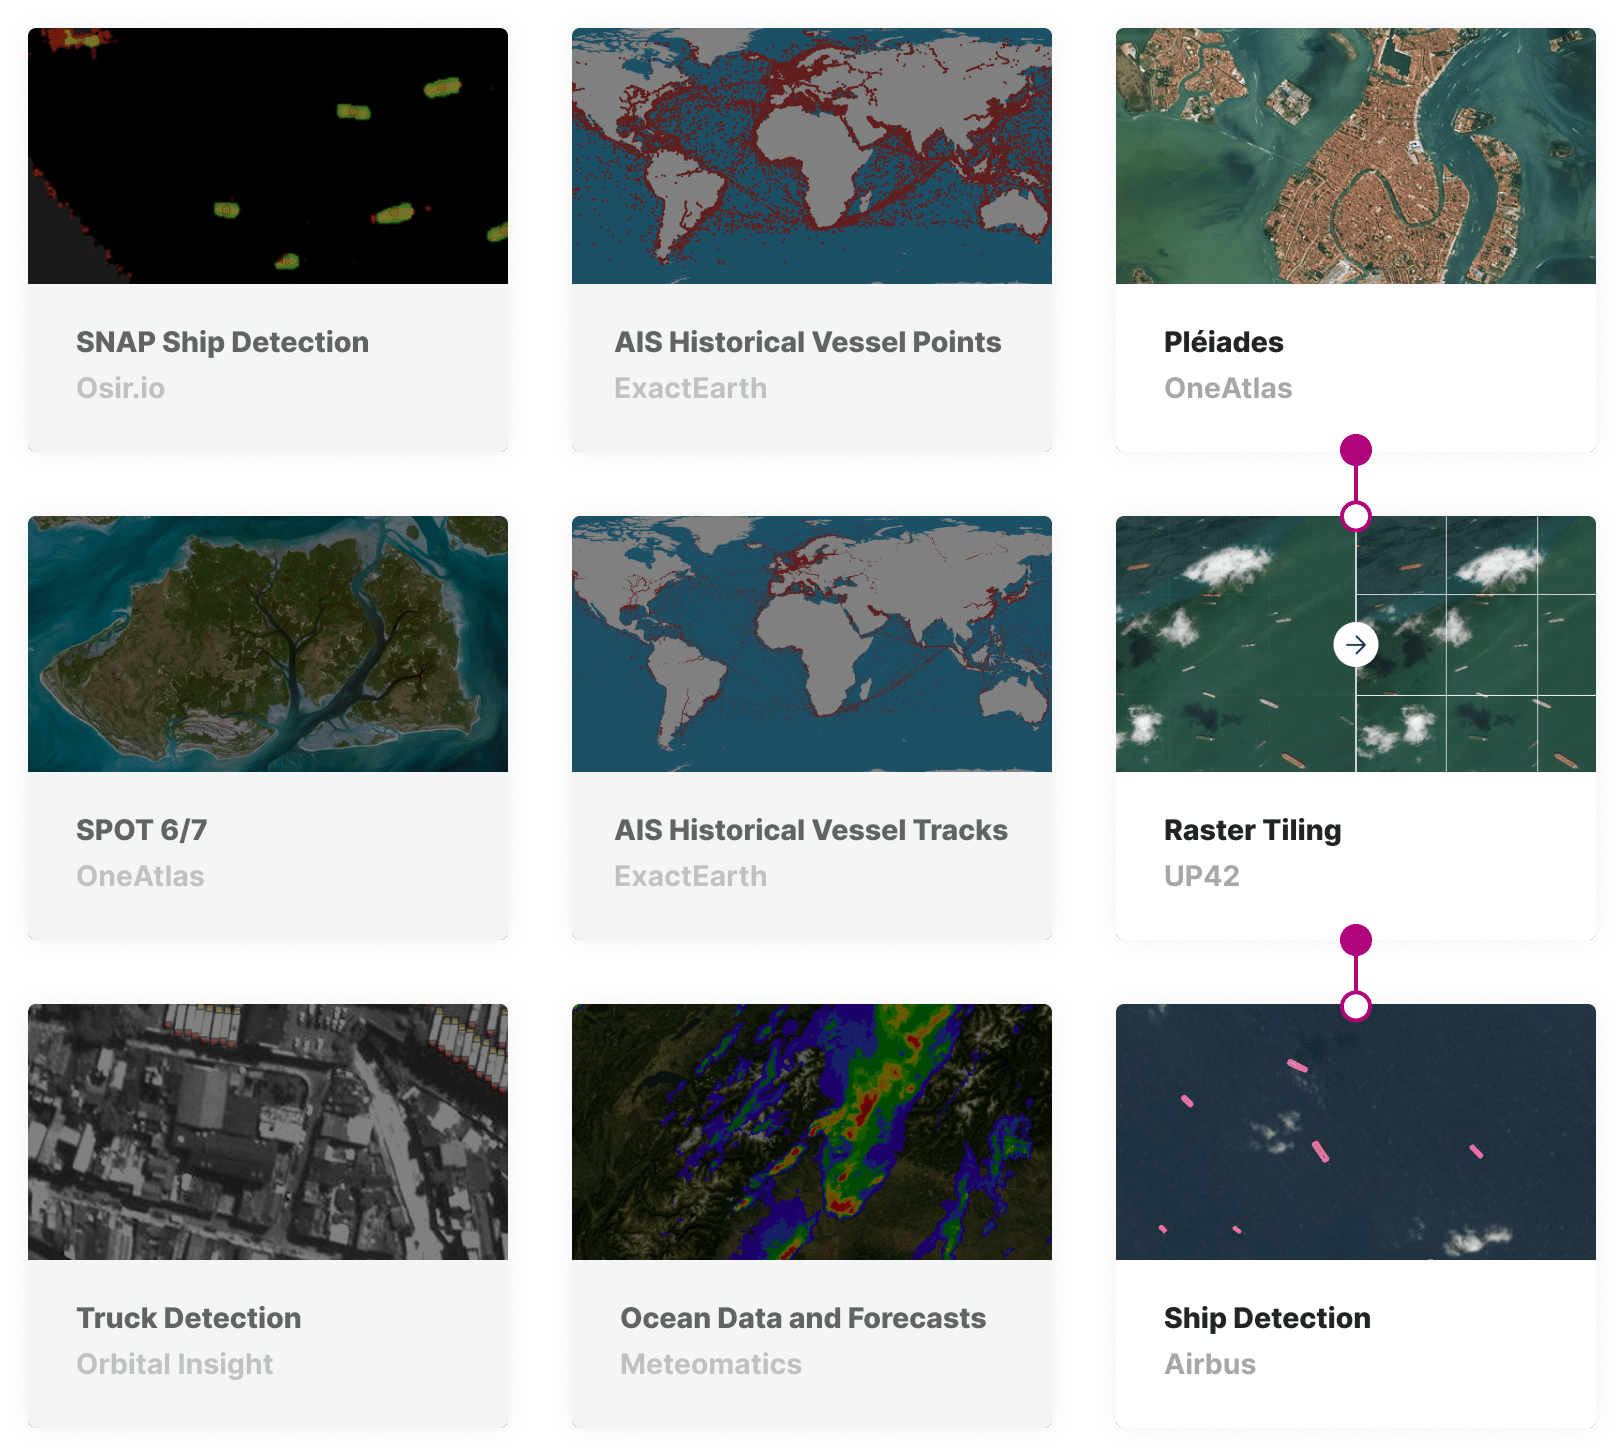
Access Pleiades and SPOT imagery

With vast archive imagery libraries for SPOT and Pleiades, you can access the volume of data required to train prediction algorithms successfully. Additionally, our bespoke tasking service enables you to get regular, low-cloud-coverage imagery of the port to allow regular monitoring and retraining of prediction algorithms.

marketplace-port-optimization

Detection algorithms

Automatically detect vessels and trucks

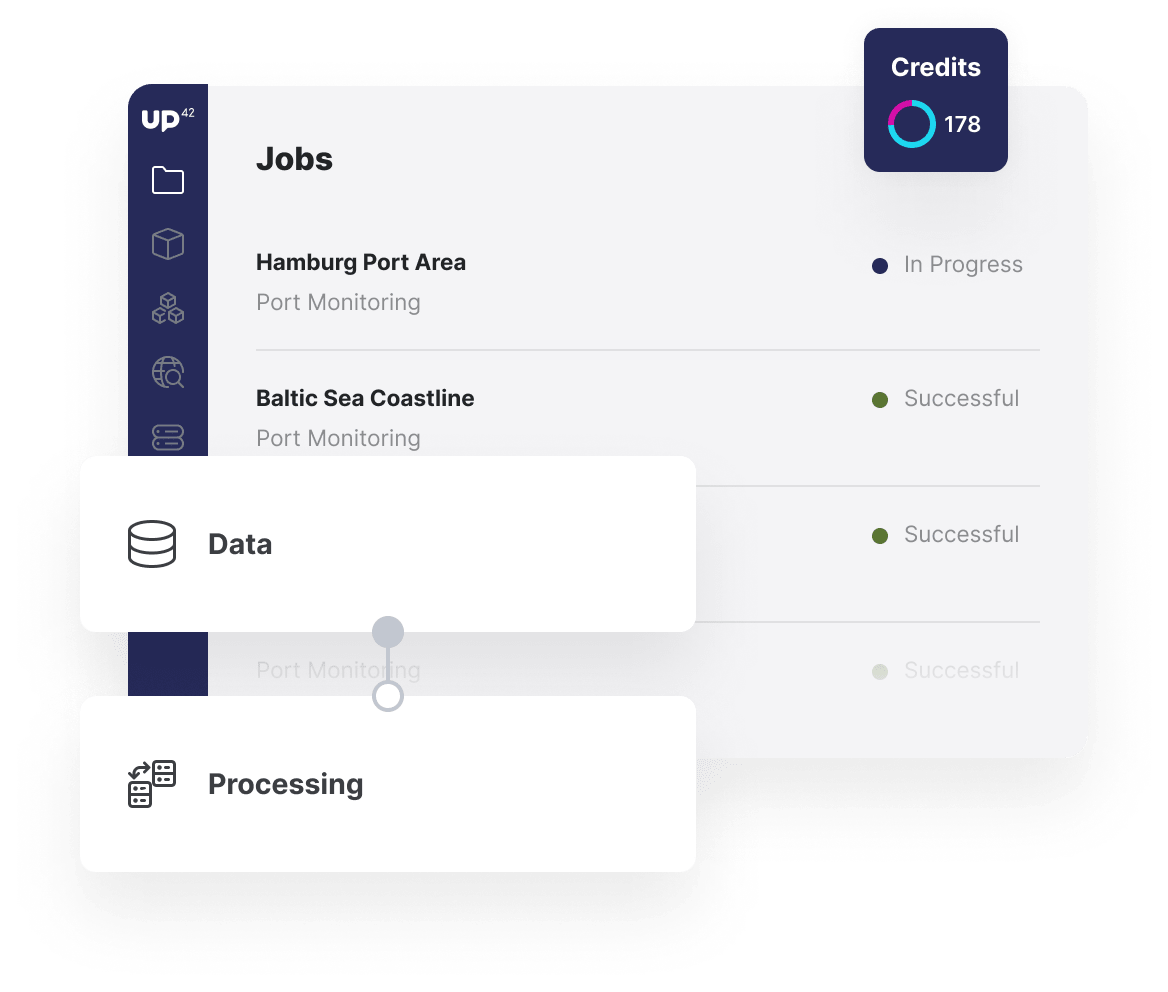
Use our Raster Tiling block to ready your satellite imagery for machine-learning algorithms. Subsequently, process the data with Airbus and Orbital Insights algorithms that detect trucks and ships on SPOT 6/7 and Pleiades streaming data, respectively.

jobs-workflows-port-optimization

Custom algorithms

Predict vessel and truck traffic

Imagery with ships and trucks detected can be used to create time-series data sets that show the changes in truck and vessel traffic over time. Build accurate forecasting algorithms by leveraging open-source machine-learning libraries alongside these time-series datasets. Easily bring these algorithms into UP42 as a custom block, using our block utilities functionality, enabling your entire analytics workflow to be processed on UP42's scalable infrastructure.

custom-blocks-port-optimization

API and Python SDK

API AND PYTHON SDK

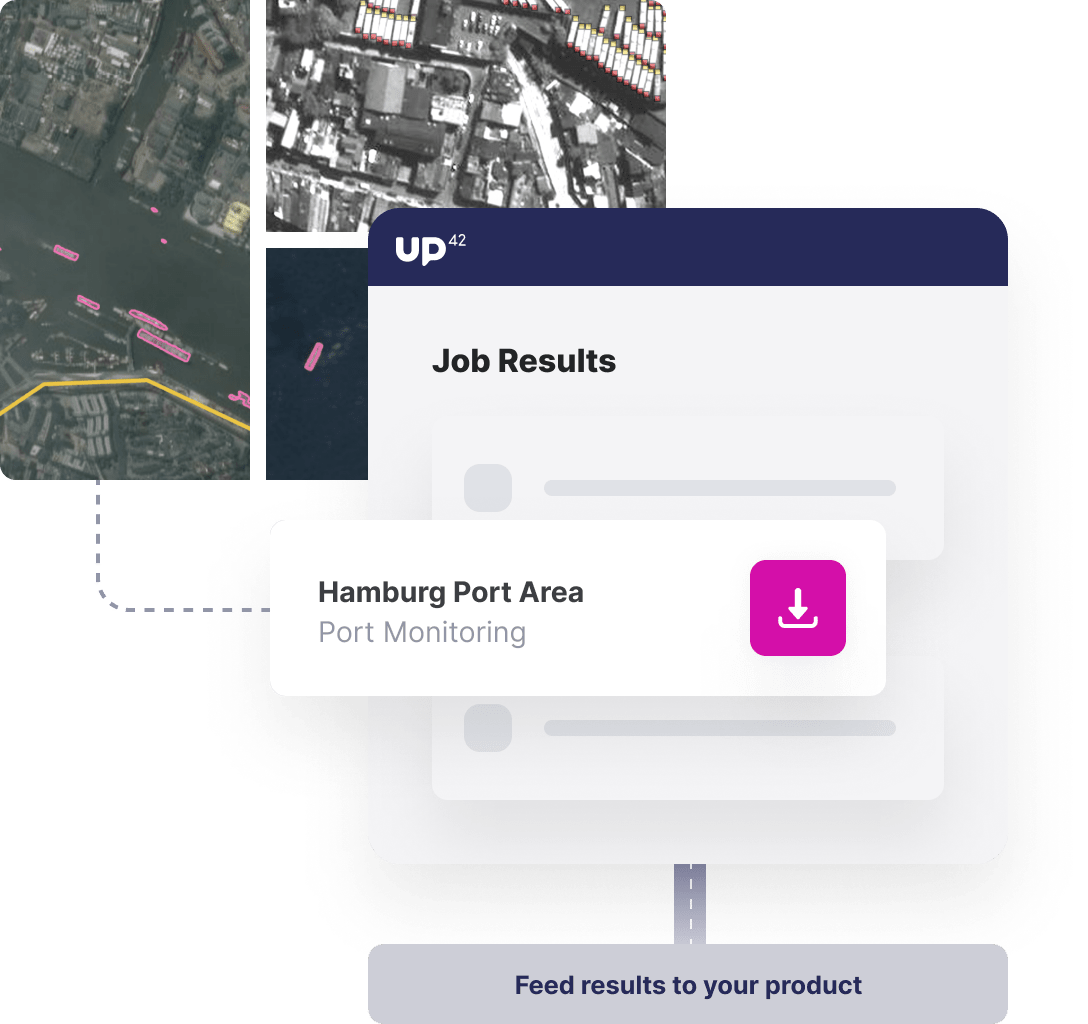
Easily download or integrate results The outputs of your entire analytics workflow are easily accessible via API. The Python SDK enables the comfortable download or integration of the results into external tools. The downloaded outputs can be visualized in GIS tools, such as QGIS. Furthermore, the SDK allows the workflow to be triggered automatically or, for larger areas of interest, for the jobs to be parallelized for extra scalability.

Access our Python SDK

import up42
up42.authenticate(project_id="12345", project_api_key="12345")
project=up42.initialize_project()

workflow = project.create_workflow(name="Ports", use_existing=True)
input_tasks=['oneatlas-spot-aoiclipped', 'tiling', 'ship-detection']
workflow.add_workflow_tasks(input_tasks=input_tasks)
parameter = workflow.construct_parameters(
    geometry=[13.452029, 52.496316, 13.459797, 52.500888],
    geometry_operation="bbox",
    scene_ids="DS_SPOT7_201909220949204_FR1_FR1_SV1_SV1_E013N53_03414")
parameter["tiling:1"].update({"match_extents":True})

job = workflow.run_job(input_parameters=parameter, track_status=True)
job.download_results()

Explore the platform

Create an account to order, access, and analyze geospatial data.

Get started