Logistics & Supply Chain Management

Use Case

Monitor Activity At Supply Chain Hubs

Increase visibility into activity at and between key supply chain locations by analyzing high-resolution satellite imagery.

Intro

Supply chain monitoring with UP42

As supply chains become increasingly complex and geographically distributed, it becomes more difficult to effectively monitor, manage, and ensure the continuity of manufacturing and distribution processes. Satellite imagery and analytics provide visibility into that supply chain, enabling you to monitor activity automatically and implement alert systems for risks or anomalies.

Overview

Access high-resolution satellite imagery

Task regular imagery of critical locations in your supply chain. Access that imagery in the UP42 console, integrated into your cloud storage, or via API in your own tools.

Monitor activity and risks in your supply chain

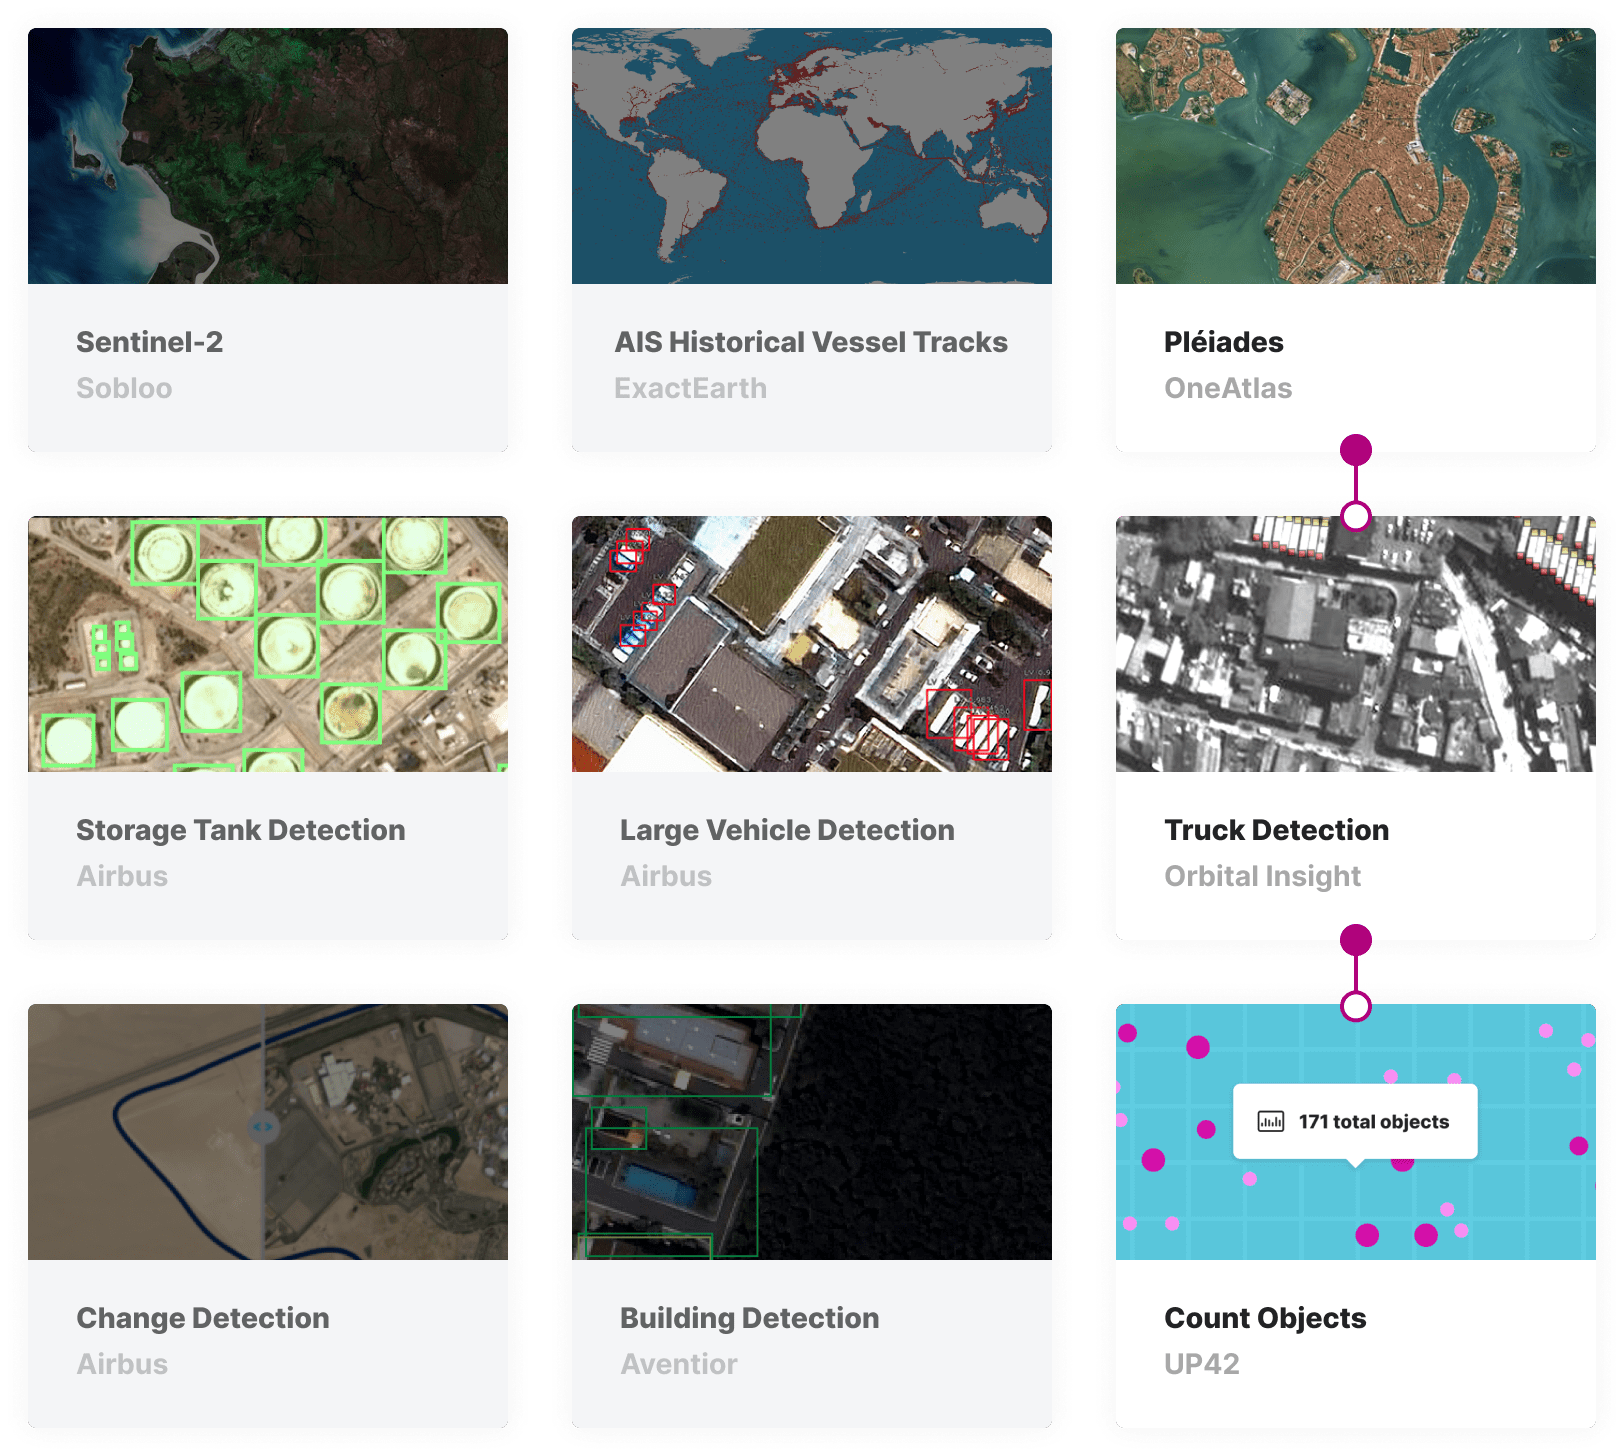
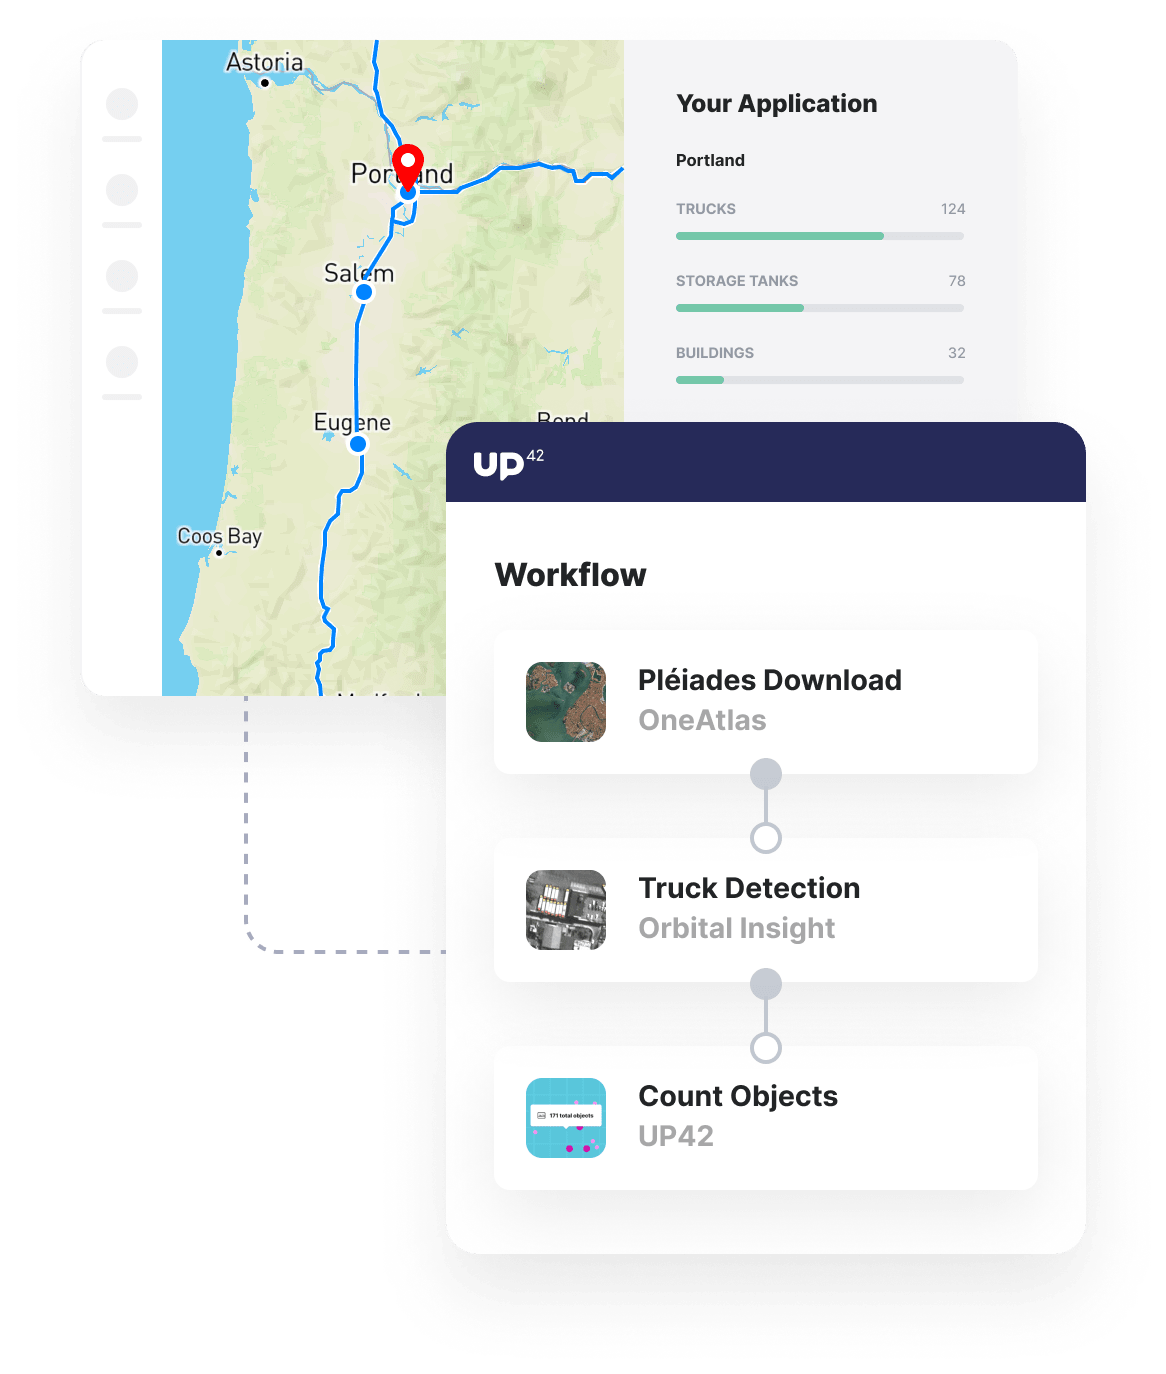
Run your satellite imagery through processing algorithms to detect change and count the number of objects of interest, such as trucks, storage tanks, and more.

Combine insights in your analytics tools

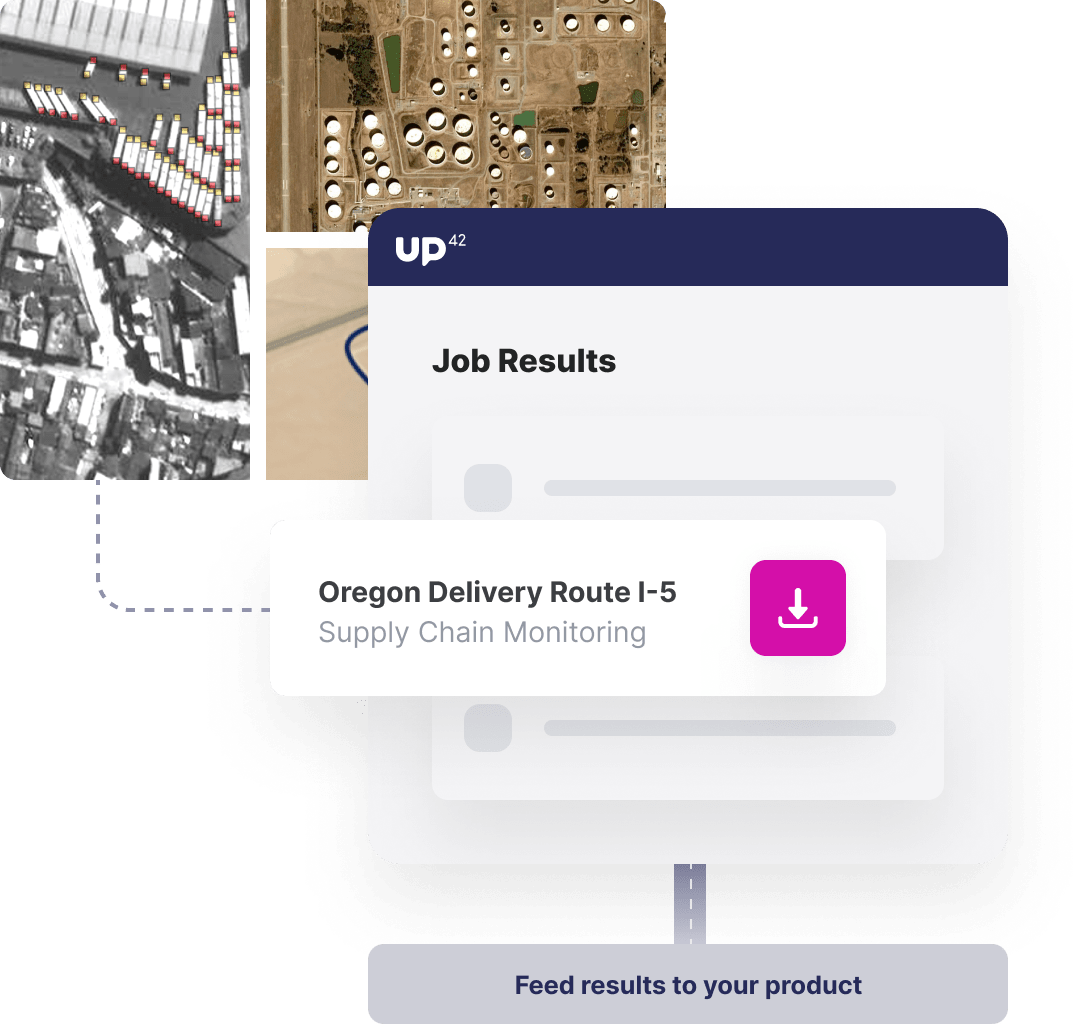
Integrate the outputs of your change and object detection algorithms into analytics tools, existing supply chain management software, or alert systems - all via API.
usecase-supply-chain
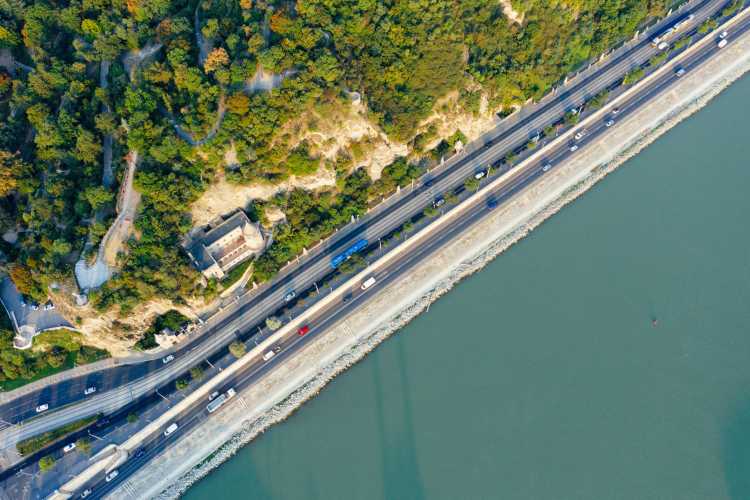
aerial-road

Benefits

Benefits for you

  • Access a vast library of archive imagery alongside the ability to order satellite tasking easily.
  • Use tried-and-tested detection algorithms for objects, such as trucks, buildings, and storage tanks.
  • Maintain maximum flexibility with all insights available via API and accessible in your own storage and tools.
  • Supplement archive data with the latest data, utilizing our bespoke tasking service.

Benefits for your customers

  • With regular tasked imagery processed in scheduled workflows, you can be sure that information is up to date.
  • Save time and ensure reliable information by circumventing regular status checks with site managers.
  • Avoid adding another software platform to your stack. Receive insights directly into existing tools via API.

The technical details

How can you use UP42 to build supply chain management solutions?

Data

High-resolution satellite imagery

Order regularly tasked imagery at a 0.5 m resolution from Pleiades or a 1.5 m resolution from SPOT with a guaranteed maximum level of cloud coverage and incidence angle. Receive your imagery directly in your user storage in the UP42 platform or upload it into your cloud storage, where you can integrate it into an UP42 workflow with ease. Supplement your satellite imagery with real-time weather and AIS data for more holistic analysis.

marketplace-supply-chain

Processing

Detect objects in your imagery

Identify and count the number of various objects in your imagery. For example, you can apply truck detection from Orbital Insights to your Pleiades imagery to analyze whether the number of trucks at a warehouse is sufficient to distribute a large shipment or whether that large shipment is already on route.

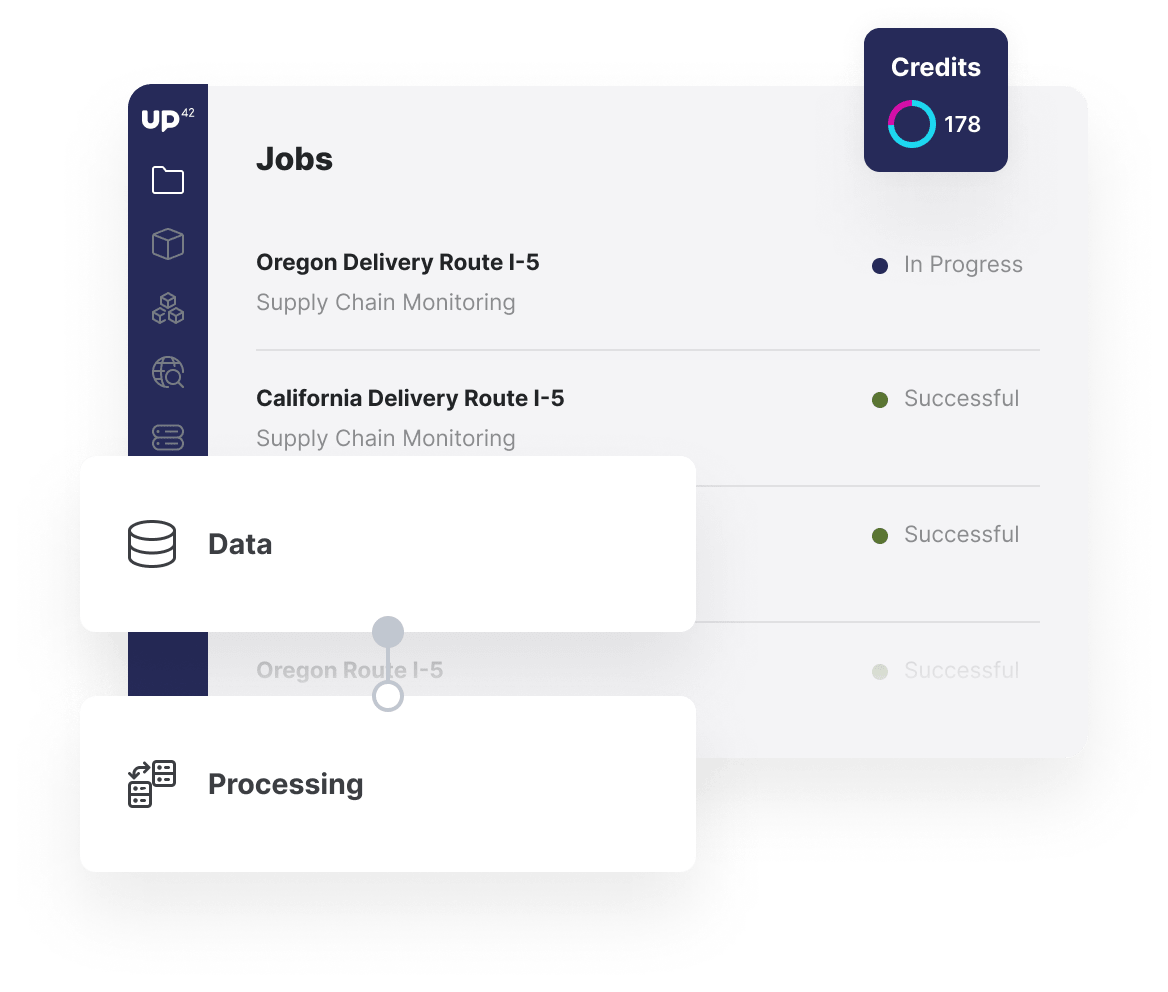
jobs-workflows-supply-chain

Risk analysis

Identify change and monitor risks

Create powerful time-series data sets by integrating your NDVI analysis's outputs into the analytics tool of your choice. For example, you could access the data set in Jupyter Notebooks and plot changes in NDVI year-on-year, taking into account seasonality. These NDVI values can be correlated to crop yield in a given country to predict crop yield for the upcoming year. These predictions can be used as one input for the prediction of agricultural commodity prices.

custom-blocks-supply-chain

API & Python SDK

Automate your analysis

Build and automate analytics workflows leveraging UP42's infrastructure but working in Jupyter Notebooks or other command-line tools. With our Python SDK, you can access all the functionality of the UP42 platform within the command line, enabling UP42 to work seamlessly within your existing processes, interacting with your regular analytics workflows, tools, and libraries.

Access our Python SDK

import up42
up42.authenticate(project_id="12345", project_api_key="12345")
project=up42.initialize_project()

workflow = project.create_workflow(name="Supply Chain", use_existing=True)
input_tasks=['oneatlas-pleiades-aoiclipped', 'tiling', 'orbital_pleiades_trucks', 'up42-countobjects']
workflow.add_workflow_tasks(input_tasks=input_tasks)
parameter = workflow.construct_parameters(
    geometry=[13.4466, 52.495598, 13.453016, 52.499216],
    geometry_operation="bbox",
    scene_ids="DS_PHR1A_202005061019188_FR1_PX_E013N52_0513_01183")
parameter['tiling:1']['tile_width']  = 1232
parameter['tiling:1']['tile_height'] = 1232

job = workflow.run_job(input_parameters=parameter, track_status=True)
job.download_results()

Explore the platform

Create an account to order, access, and analyze geospatial data.

Get started