Real Estate Trend Analysis > Benefit Image

Use case

Analyze and predict market trends

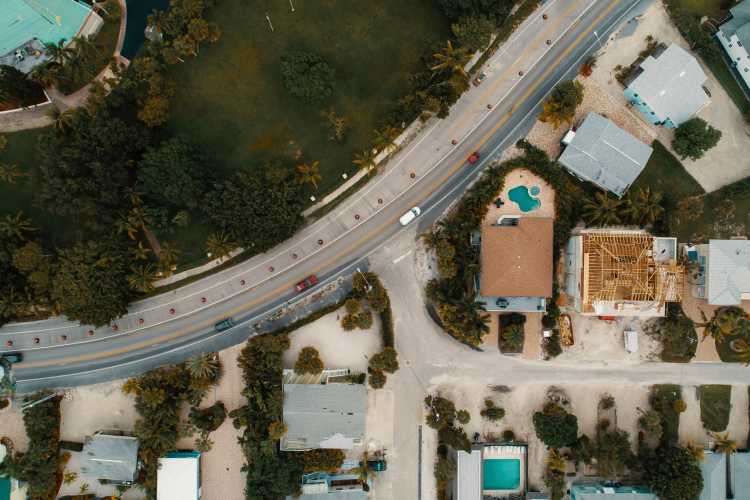
Provide real estate investors with the edge they need by spotting market trends through the use of geospatial data and analytics.

Intro

Real estate trend analysis with UP42

Financial and real estate investors rely on having the edge over their competitors, leveraging data, insights, and tools that enable them to make better, more timely investment decisions. High-resolution satellite data processed by machine-learning algorithms provide that edge by giving investors more accurate, more timely info and predictions.

Overview

High-resolution satellite imagery

Purchase data from a vast library of archive imagery, paying only for your AOI. Supplement archive imagery with our bespoke tasking service.

Detect and identify objects

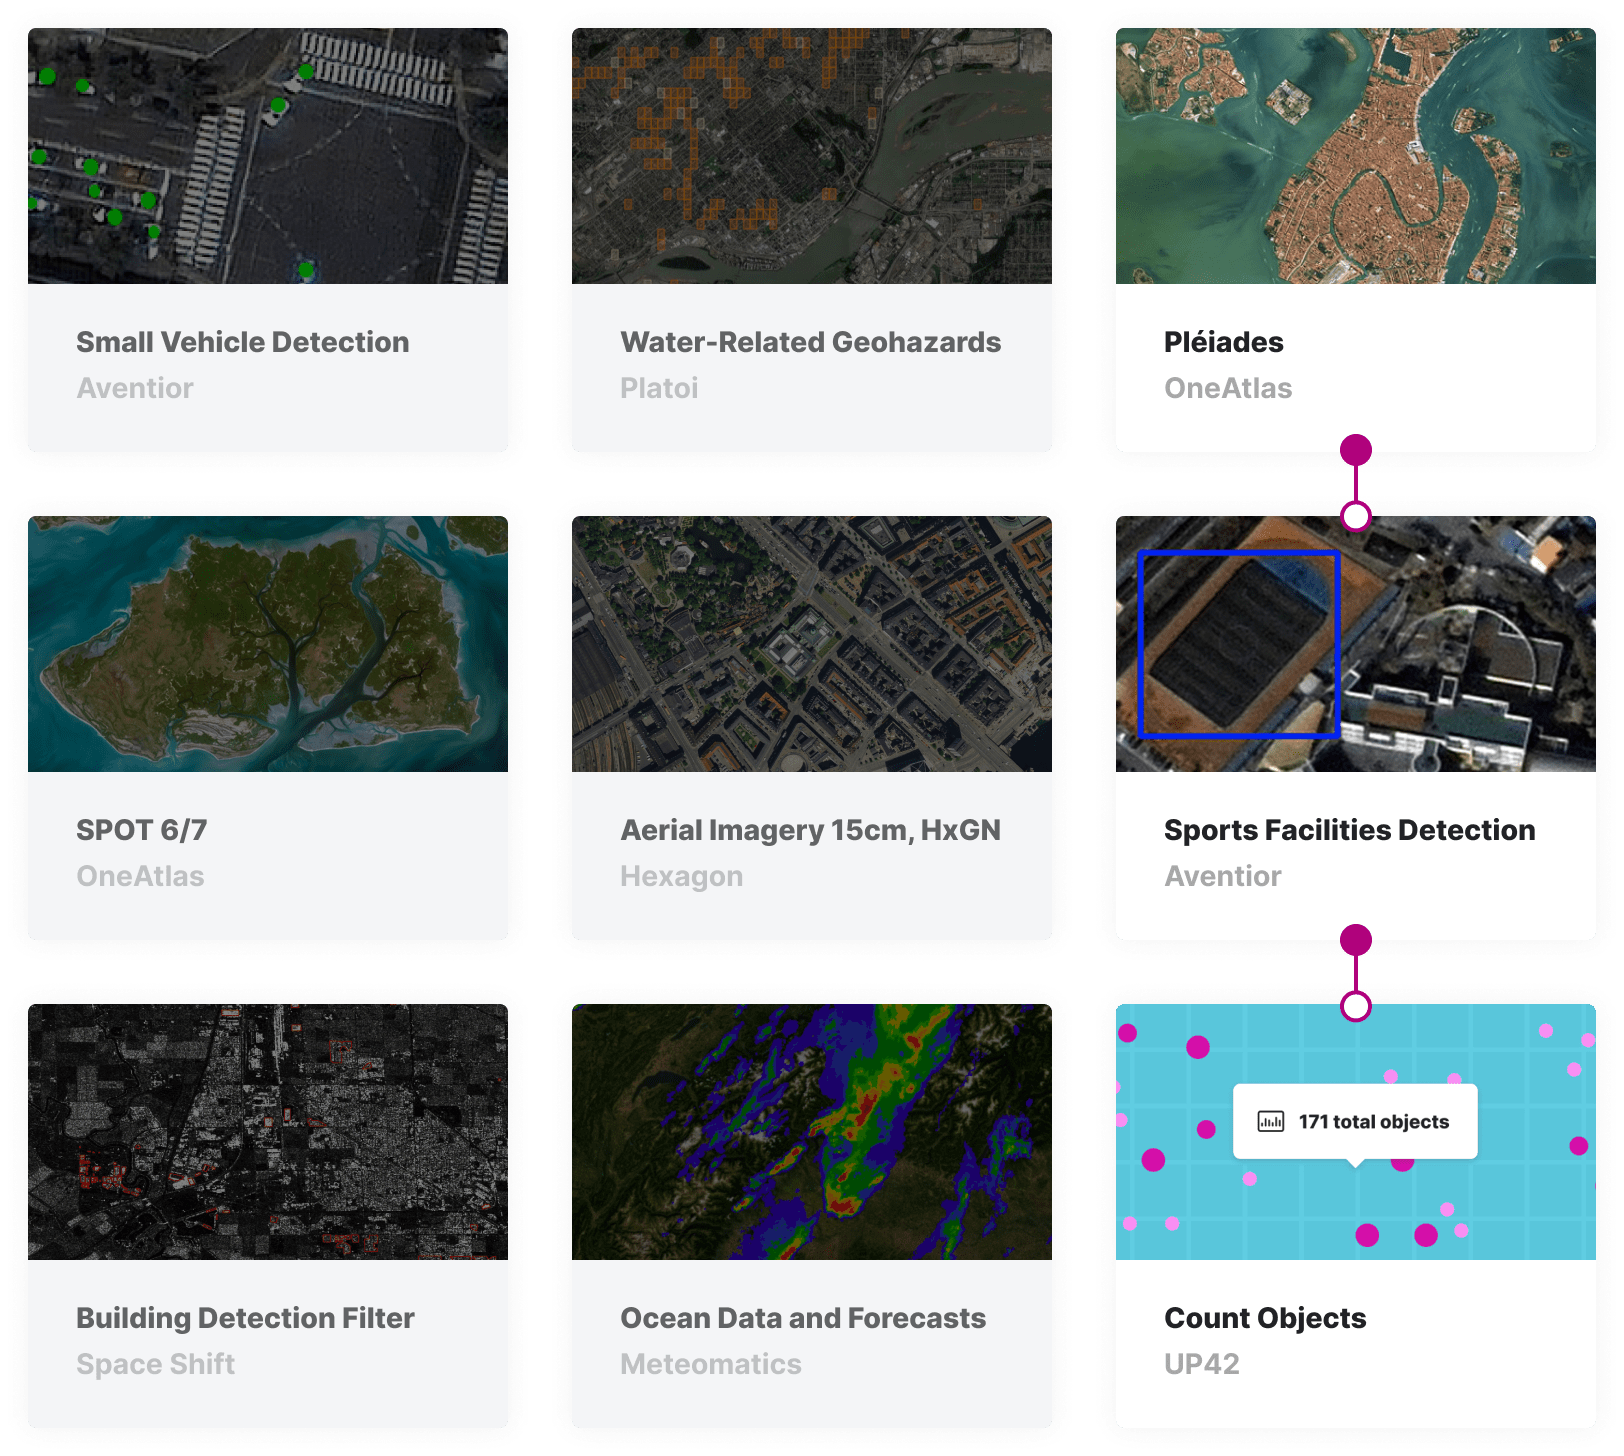
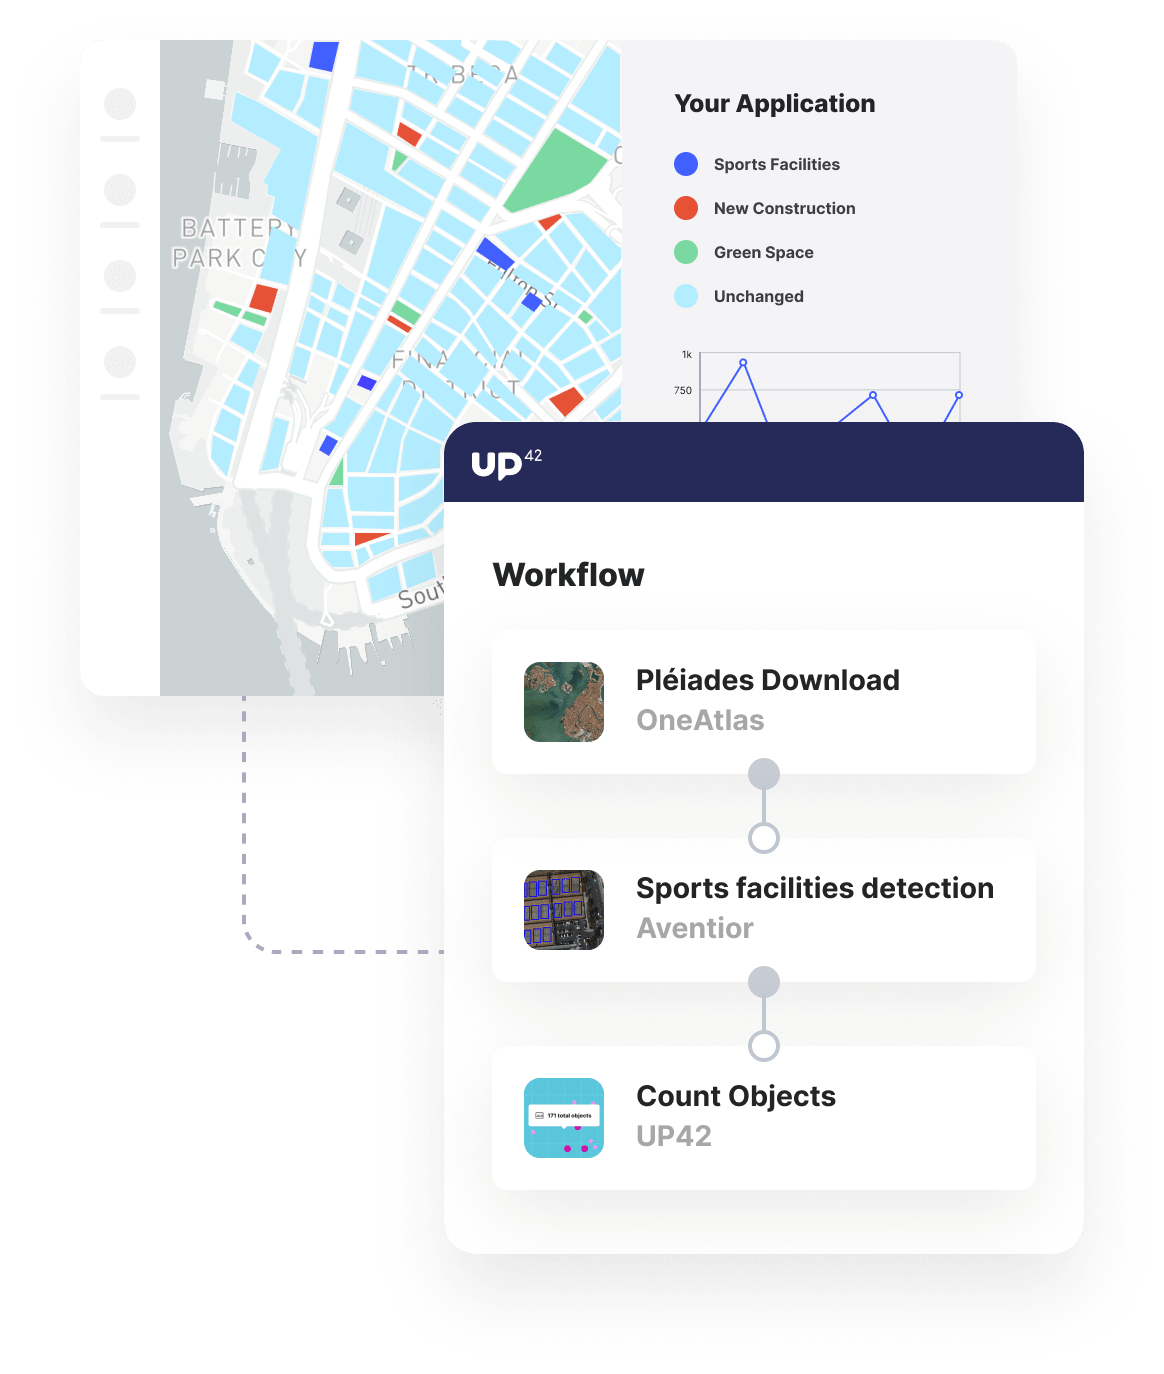
Run archive or tasked imagery through algorithms that detect objects, such as buildings, swimming pools, sports facilities, settlements, and more.

Combine insights in your analytics tools

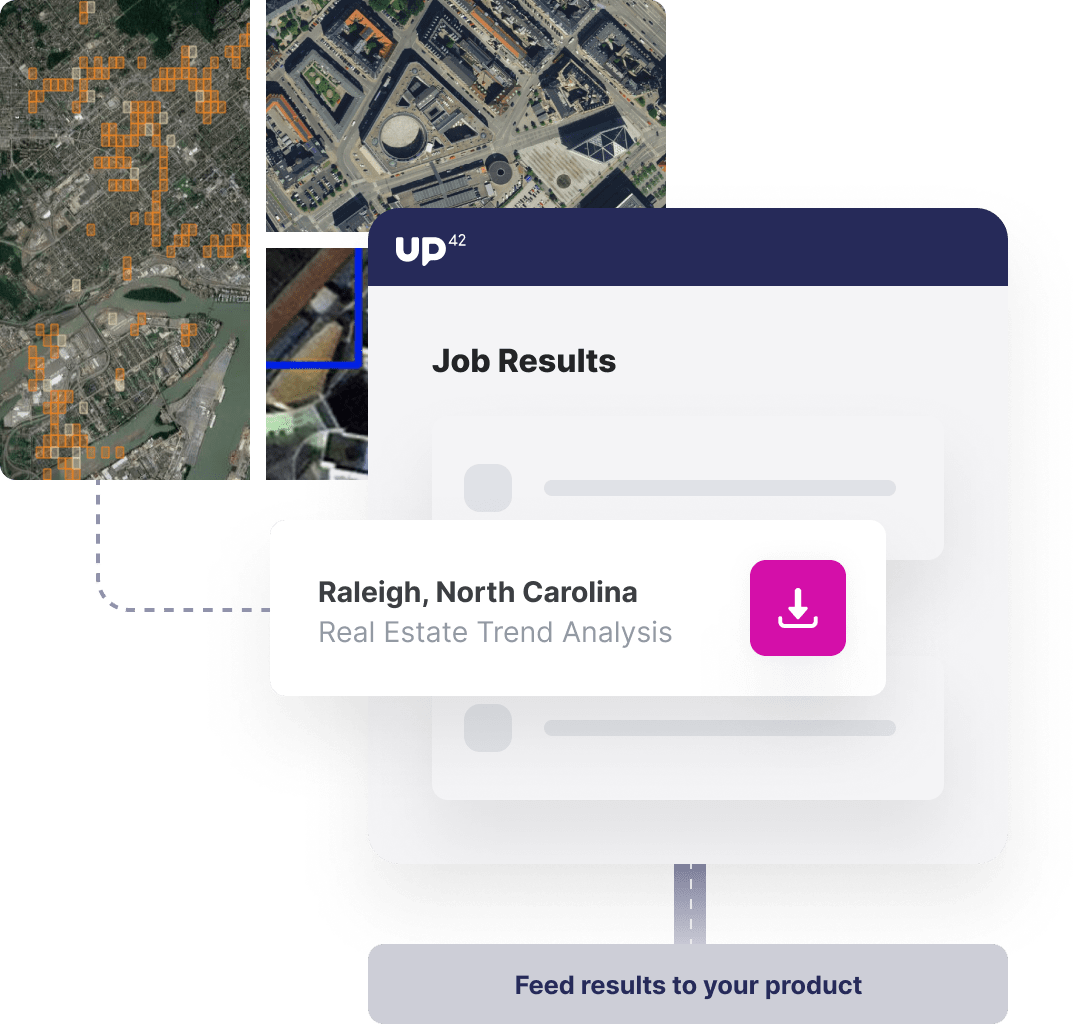
Integrate your detection algorithms' outputs into analytics tools, such as Jupyter Notebooks, to analyze areas and spot trends over time.
usecase-real-estate-trend
Real Estate Trend Analysis > Hero Image

Benefits

Benefits for you

  • Access a vast library of archive imagery to run historical analysis and analyze trends.
  • Save time and widen analysis by using a wide range of out-of-the-box detection algorithms.
  • Maintain maximum flexibility with all insights available via API and accessible in your storage and tools.
  • Supplement archive data with the latest data, utilizing our bespoke tasking service.

Benefits for your customers

  • With some regular archive imagery extending back over ten years, you can be sure that trends are reliable.
  • Move from static market reports to live market information as all analysis can be automatically run regularly.
  • Avoid adding another software platform to your stack. Receive insights directly in existing tools via API.

The technical details

How can you use UP42 to build portfolio risk analysis solutions?

Data

High-quality satellite imagery

Access a vast archive of high-resolution Pleiades imagery, paying only for the data within your area of interest. Build up a set of archive images at regular intervals in order to run analysis where you can track changes over time. To ensure your analysis is as up to date as possible, you can commission the Pleiades constellation for a specific date range, with a guaranteed maximum cloud coverage.

marketplace-real-estate-trend

Processing

Detect objects in your imagery

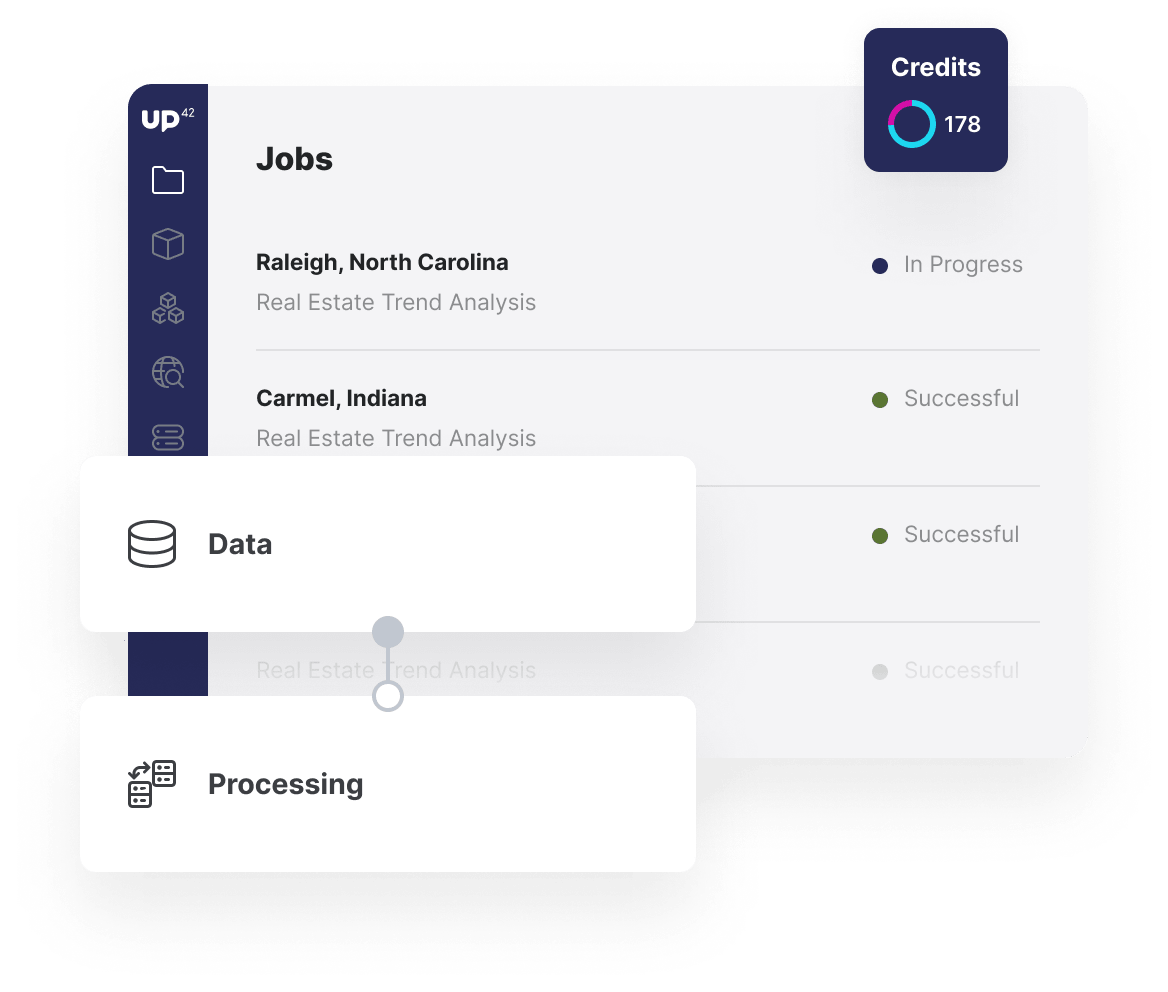
Analyze your Pleiades imagery by running them through a range of detection algorithms that detect objects, which are indicators of changing values or market dynamics. Process the output of detection algorithms with the UP42 Count Objects block that provides a single output of the number of objects detected by the algorithm.

jobs-workflows-real-estate-trend

Time series

Assign value and plot over time

Estimate the value provided by different objects within the satellite image and combine the different detection algorithms and Count Objects block outputs to give each area of interest an overall value indicator. Place this value indicator in a time series data set to identify AOIs where value growth or loss occurs.

custom-blocks-real-estate-trend

API

Automate your analysis

Build and automate analytics workflows leveraging UP42's infrastructure but working in Jupyter Notebooks or other command-line tools. With our Python SDK, you can access all the functionality of the UP42 platform within the command line, enabling UP42 to work seamlessly within your existing processes, interacting with your regular analytics workflows, tools, and libraries.

Access our Python SDK

import up42
up42.authenticate(project_id="12345", project_api_key="12345")
project=up42.initialize_project()

workflow = project.create_workflow(name="Urban", use_existing=True)
input_tasks=['oneatlas-pleiades-aoiclipped','sports-detection', 'up42-countobjects']
workflow.add_workflow_tasks(input_tasks=input_tasks)
input_parameters = workflow.construct_parameters(
    geometry=[13.417182, 52.509091, 13.42216, 52.512434],
    geometry_operation="bbox",
    scene_ids="DS_PHR1B_202004231019525_FR1_PX_E013N52_0513_01239")

job = workflow.run_job(input_parameters=input_parameters, track_status=True)
job.download_results()

Explore the platform

Create an account to order, access, and analyze geospatial data.

Get started