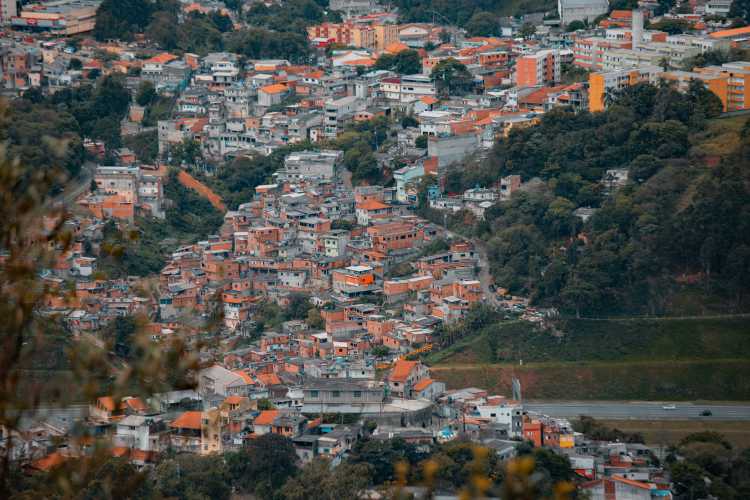
In 2014, Brazil experienced its worst drought in 100 years. After months of unusually low precipitation amounts, water reservoirs were drying up, which led to rationing in 19 cities in the south-east of Brazil. Water levels of the Cantareira water supply system of São Paulo, Brazil, fell to extremely low levels as the drought continued. For context, the Cantareira water supply system consists of five interconnected reservoirs and provides water to the entire São Paulo metropolitan area, which has over 21 million inhabitants.
Using UP42's Python SDK to scale, this article takes the example of São Paulo's Jaguari reservoir, one of the five reservoirs in the Cantareira system, and showcases how you can obtain scalable insights from satellite imagery and weather forecasts to monitor precipitation, to determine weather and climate influences on lakes and reservoirs.
How Can Accessing Reservoir and Lake Surface Data With APIs Help?
Tracking changes in lakes and reservoirs generally requires the monitoring of extensive areas, which can often result in compromises to either budget, spatial resolution, or temporal resolution. These compromises can lead to budgetary shortfalls or unaccounted for water shortages due to insufficient data.
Even the most proactive utilities have been known to update water level databases once a week, and this data is generally taken at a couple of points and then interpolated, leaving much to be desired for spatial resolution or temporal resolutions. By leveraging scalable APIs and geospatial data like weather data from Meteomatics or Terra Cover's ReaLSAT (Reservoir and Lake Surface Area Time Series Data Set), you can remotely assess changes in water resources over large swaths and assess different areas or time periods in parallel, enabling in-depth and high accuracy trend analysis. Furthermore, with UP42's usage-based pricing, you can maintain affordability for large AOIs without compromising on resolution.
How to Leverage Data on the UP42 Marketplace and Analyze Changes in Reservoirs Using Data Available In Meteomatics API
In order to analyze the changes in the reservoir, Meteomatics uses satellite data from Terra Cover's' ReaLSAT (Reservoir and Lake Surface Area Time Series Data Set). ReaLSAT is a satellite-based data set that monitors the surface area of over 60,000 lakes and reservoirs. The dataset includes a time series of the surface area for each water body, as well as a shapefile, as depicted in the picture below of the Jaguari reservoir:
 Underlying satellite imagery from Sentinel 2 data with reservoir shape from ReaLSAT data set
The ReaLSAT data set is available on the UP42 platform as a data block. Also available on the platform are data blocks from Meteomatics, a weather data provider that offers global hyper-localized weather forecasts and historical data, downscaling horizontally to 90m and 5-minute time steps. In this analysis, we used the precipitation data from the Meteomatics data block.
How to Leverage the UP42 Python SDK to Access Quality Geospatial Data at Scale
The ReaLSAT data can be accessed simply through the UP42 API in Python.
In the first step, the project can be initialized like this:
import up42

up42.authenticate(cfg_file="config.json")
project = up42.initialize_project()
workflow = project.create_workflow(name="terracover-workflow")
#Add workflow tasks
input_tasks = ['terracover-realsat-historical']
workflow.add_workflow_tasks(input_tasks=input_tasks)
Then the AOI needs to be defined. In order for the right reservoir to be chosen, the box defining the AOI has to overlap the water body of interest but doesn’t need to contain it fully.
The AOI used for this example was the following:
aoi = [-46.40213, -22.981271, -46.362433, -22.959421]

#input parameters
input_parameters = workflow.construct_parameters(geometry=aoi, geometry_operation="bbox", limit=10)
When defining the input parameters, the limit has to be also set. Since this example uses a time series for this analysis, it's important that the user loads as many data points per job as possible. The maximum limit is 10; when adding a credit card, the limit can be extended to 20.
To run a job, the user also has to define the date range, as shown here for the first 10 months.
input_parameters["terracover-realsat-historical:1"].update({"time": '1984-01-01T00:00:00+00:00/1984-11-01T00:00:00+00:00'})
#Run the job.
job = workflow.run_job(input_parameters=input_parameters, track_status=True)
#Download job result
results_fp = job.download_results()
It requires several runs to get the whole time series from 1984 to 2015. For convenience, we suggest writing request(s) in a loop.
When all the data is downloaded, it can be plotted as a time series. The following plot shows the change in the surface area of the Jaguari reservoir. The drought in 2014 is clearly visible in the data set.

Meteomatics' Weather and Climate Data can be accessed similarly, but when creating the workflow, meteomatics has to be used as the input task instead.
A time series was created for this analysis, so the AOI for the Meteomatics data set was set to only contain one grid point per time step. Alternatively, the data could also be loaded for the whole area and then averaged over the domain.
The parameter used is precip_24h:mm which is the accumulated precipitation over the last 24 hours. The time interval is set to 24, so we get one value every 24 hours:
input_parameters["meteomatics:1"].update({"variables": ['precip_24h:mm'], time_interval": 24})The data can then be downloaded in the same manner as the Terra Cover data set. In order to visualize the trends in the daily precipitation pattern, the mean precipitation for each year was calculated:

This plot shows clearly that in 2014 there was less precipitation present than usual. It is clear that there is a connection between precipitation and reservoir area when the two time series are combined as per below:

Conclusion & Outlook
The historical analysis shows that there is a clear relationship between the precipitation and the reservoir area. When there is a period of below-average precipitation, this has a clear effect on the reservoir size. The effect is strongest in 2014 when the yearly precipitation was exceptionally low. The anomalous precipitation led to an extreme decrease in the reservoir water level, creating water scarcity and the need for rationing.
But also before 2014, the data suggest a relationship between water levels and precipitation. This shows that monitoring the weather and using forecast data can be utilized for managing water supply. This analysis could be extended to create a water supply forecasting model that enables decision-makers to undertake mitigation strategies.
In this example and further possible applications, the Terra Cover ReaLSAT data proved to be a useful tool for monitoring the reservoir water level. The combination with Meteomatics' weather data makes it possible to gain insight into relationships with weather parameters and use forecasts for risk mitigation.
With Meteomatics, users can access more than 5 Petabytes of accurate and hyper-localized weather data through a single RESTful API endpoint, providing a convenient and consistent data access method. Empowering use cases throughout the globe, with data available across all timescales: historic, nowcast, forecast, seasonal, and climate projections.
For more information, check out Meteomatics' and Terra Cover's capabilities on the UP42 marketplace.


