As our world warms, taking the Earth's temperature has never been more important. This is a guest post by our friends at ConstellR on Land Surface Temperature data and temperature monitoring today.
Today, visual and radar imagery are the dominant Earth observation data sources—and we have amazing imaging capabilities to do both: we can consistently acquire a high-resolution image of the entire globe within 24 hours.
Recently, there is an emerging interest in thermal infrared data to obtain our planet’s surface temperature—through land surface monitoring or Land Surface Temperature (LST) data. With climate change at our doorstep, knowing information such as surface warming trends and heat flux areas is more critical now than ever.
But first, what is LST data, and how is it collected? This article will give a brief overview of the topic of remote sensing in general, explore thermal infrared data specifically, and why taking the Earth’s temperature is so important.
What is Earth surface monitoring?
The history of Earth observation
Earth observation (EO) or satellite-based remote sensing is a technology that allows for the monitoring of our planet from space. The adventures of EO from space started back in 1946:
The first pictures were taken with a modified V2 rocket and a film camera and were black and white (below). Since then, a lot has happened in Earth observation; many systems have been developed and improved. Today we can observe our planet continuously.
 The first image of Earth from an altitute of 105 km ("space" starts at 100 km)
To capture new developments, today, around 700 individual satellites are hovering in and around different spheres.
In other words, with different types of satellites, there are different types of instruments to survey our Earth’s surface and atmosphere.
Through various sensors and instruments such as visual (VIS), radar (SAR), or infrared (IR), we can, therefore, make sense of activities such as our __agricultural and water management or monitor the planet’s development over decade__s.
Types of EO systems
Each EO satellite system serves certain aspects of a couple of technologies. Here are a few examples:
Visual
Systems in the visual (VIS) range offer - simply put - the same color reproduction as the human eye and work according to the same principle.
Radiation in the range of about 400 to 800 nm is emitted by an object (sun, lamp) or mostly reflected (practically every surface), imaged on a sensor, and processed by a data processing unit (brain, computer).
It is, therefore, a passive system — meaning it does not emit any radiation itself.
The spectral resolution of EO systems in the VIS regions can be much higher than in the human eye. While today’s screen can fool our eyes by operating three spectral channels (red, green, blue) —multi- and hyperspectral EO systems can "see" dozens to hundreds of channels. In image analysis, particular spectral features of substances can be analyzed.
Radar
Radar systems operate in a completely different spectral range (wavelength in the cm range) and offer the advantage of penetrating certain kinds of matter — including clouds. This ability makes radar satellite systems ideal for permanent, weather-independent monitoring.
Furthermore, radar sensors are active systems: the radar device sends a primary signal reflected by an object (e.g., the Earth's surface). This echo is recorded by the radar device and is used for imaging the area.
The advantage is that it does not rely on sunlight; hence you can use this technique to take images at night.
 How radar works: the satellite emits the primary signal, which can even penetrate clouds. Structures on the ground reflect the echo according to their intrinsic features. The echo is detected by the satellite.
Infrared
Between these two spectral ranges lies the so-called infrared (IR) spectrum. IR wavelengths extend from about 800 nm to 1 mm and are further subdivided due to the width of the spectrum:
- Near-infrared (NIR): 780 nm to 1400 nm
- Short-wave infrared (SWIR): 1,4 to 3,0 µm
- Medium-wave infrared (MWIR): 3,0 µm to 8 µm
- Long-wave infrared (LWIR): 8 to 15 µm
- Far-infrared (FIR): 15 µm to 1 mm
Like information in the visual spectrum, information in the IR region is obtained in a purely passive way.
However, while in the visual spectrum, we look at reflected light to a very large extent, in the IR we can record light emitted from a certain wavelength.
Emitted means that the object under observation itself emits radiation. This is because all bodies on Earth (and also in the rest of the universe) have a temperature above absolute zero, and this __temperature is detectable as radiatio__n.
When taking Earth’s temperature, we’re interested in thermal infrared (TIR) specifically, which has a wavelength of 3 to 14 µm, corresponding to (black body) temperatures of between -60°C and 700 °C.
Let’s take a closer look at thermal infrared:
What is thermal infrared data (TIR)?
As we’ve just learned, infrared satellite systems use specialized sensors to detect infrared radiation emitted from the Earth’s surface.
The thermal infrared radiation (TIR) region encompasses both the middle-wave (MWIR) and long-wave infrared (LWIR).
TIR is emitted from warm objects such as the Earth’s surface—with some areas much warmer than others.
TIR remote sensing can provide essential measurements of surface energy fluxes and temperature changes—integral to understanding Earth’s processes.
Since TIR is an emission and does not inherently require an external illumination source like in the visual spectrum—TIR images can also be taken at night.
What is Land Surface Temperature Monitoring?
Land Surface Temperature (LST) is the radiative temperature of the land—derived from previously mentioned thermal infrared radiation that the Earth’s surface emits.
LST is essentially a measure of how hot Earth's surface would feel to the touch in a particular location.
 LST data collected during the daytime by the Moderate Resolution Imaging Spectroradiometer (MODIS) on NASA’s Terra satellite (Credit: NASA)
The Earth has an average temperature of about 15 °C—with temperatures on Earth ranging from -25°C (deep blue in the image below) and 45°C (pinkish-yellow).
At mid-to-high latitudes, LST can vary throughout the year. However, equatorial regions tend to remain consistently warm, and Antarctica and Greenland remain consistently cold.
 The electromagnetic spectrum: when taking Earth’s temperature, we’re interested in thermal infrared (TIR) specifically, which has a wavelength of 3 to 14 µm
How is LST data generated?
As mentioned, land surface temperature is derived from measured thermal infrared, or TIR radiation. We can determine this with the help of different sensors, which have varying characteristics.
For example, thermal infrared detectors called bolometers are mostly used on drones or ground stations due to their small volume, weight, and energy consumption. They offer a low accuracy in relative and absolute temperature measurement and are relatively inert, leading to a low ground resolution for moving systems (drones) compared to other systems. However, they are worthwhile for aircraft with small payloads.
More complex systems are generally cooled. Therefore, they offer the possibility of highly accurate relative and absolute temperature measurements (in laboratory environments up to the mK range).
In contrast to bolometers, they are significantly larger and require more energy, making them unsuitable for use on drones. These types of detectors are used on all common TIR satellite systems—including ASTER, MODIS, BIRD, and Landsat 7’s ETM+.
Why is LST monitoring important?
Thermal infrared Earth observation or TIR EO plays an essential role in various scientific and commercial fields.
The correct determination of land surface temperature is generally the basis for understanding and analyzing energy and temperature changes on our planet. Scientists monitor LST because the warmth rising off Earth’s surface influences our world’s weather and climate patterns.
Accurately understanding LST at the global and regional scales helps to understand land surface-atmosphere exchange processes and models—and how this influences plant growth. Usually, LST is a mixture of the different local properties of the existing soil and materials and substances found on the ground, such as plants, asphalt, and minerals.
The land surface temperature influences the energy distribution between soil and plants, as well as buildings. It is also a measure of the temperature of the air layers near the Earth’s surface.
A detailed understanding of this parameter helps to model climate models and the variables that depend on them.
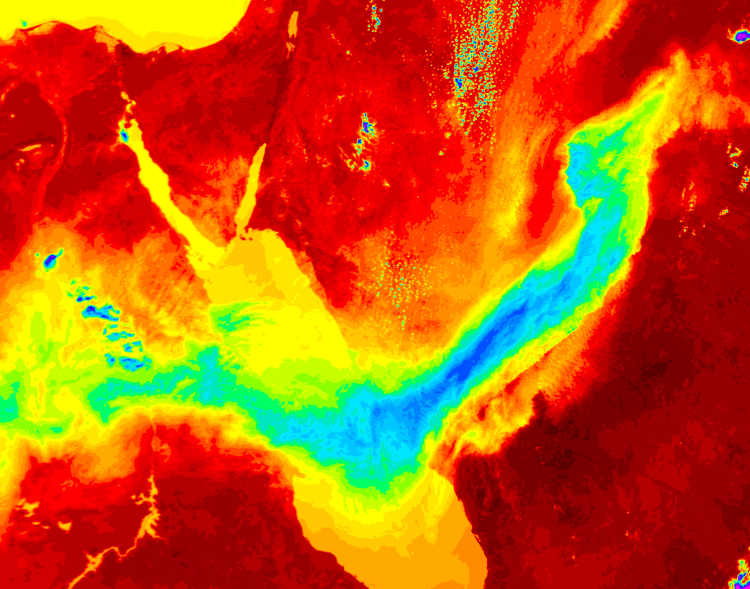
 Dust storm across the Red Sea: this LST image shows the dust as a cool blue streak over the hot and arid landscape between Egypt and Saudi Arabia on 13 May, 2005 (Source: NASA)
Sources of LST data
Currently, our thermal infrared EO capabilities are that we can generate high-resolution images of our planet in the visual and radar spectrum at any time.
Hundreds of satellites of different sizes are in orbit around the Earth, some of them from institutions like ESA, others from commercial providers like Planet and Airbus.
Here are some sources of LST data available to do land surface monitoring:
-
Landsat - thermal band 6 in Landsat 7 and band 10 and 11 in Landsat 8 - for high TIR resolution (60m) and moderate spatial resolution every couple of days
-
NASA’s MODIS - daily Land Surface Temperature data at low spatial resolutions of 1 km
-
DHI-Gras - estimates evapotranspiration from fused Sentinel 2 and Sentinel 3 data
-
ConstellR: plans to launch a constellation of satellites offering precise, daily, high spatial resolution LST data
The future of LST data
While the quality of the generated data is excellent, the small number of satellites causes a temporal and/or spatial resolution limitation.
Essentially, it can be said that currently, if you are looking for LST data, you can either:
- Obtain frequent (sub-daily) images with low ground resolution in the km range for a given region or,
- Obtain high-resolution images (< 100 m) at intervals of several days up to weeks
These two polar ends of the scale can hinder the development of commercial products based on TIR images.
That’s why companies like ConstellR have made it their business to fill this gap and to combine both by delivering spatially high-resolution LST data using a constellation of CubeSats.
Daily, globally, and using the latest sensor technology, the temperature measurements will be highly accurate.
At ConstellR, we aim to launch the first system into orbit by the end of 2021, and from 2023 onward, the constellation will be able to provide very fast, daily, high-resolution coverage of the most important areas in the world.
Applications of land surface temperature monitoring
Agri-analytics
In the agri-analytics market, LST data is an essential building block to enable more in-depth analyses that will form the basis of recommendations for action that farmers can take—therefore helping to ensure food security for the next generations:
Vegetation water stress
Monitoring LST reveals insights into vegetation water stress and supports drought monitoring.
Remotely sensed LST data can be used to calculate a crop water stress index. It is used as an indicator of water stress in wetland ecosystems, and to identify areas of water scarcity in fields to support crop yields.
For example, once launched, ConstellR’s TIR-data will enable data-analysts to estimate the actual evapotranspiration rate of plants.
This data will allow water stress in crops to be identified in days to weeks, well before plants undergo any visible physiological changes.
For more info on quantifying plant health, check out 5 Things to Know About NDVI.
 LST reveals insights into vegetation water stress
Water management
More than 70 % of global freshwater resources are attributed to agriculture, and irrigation is the main cost driver in agriculture.
Precise and high-resolution TIR data can be used for efficient irrigation management—by applying precisely as much water as is optimal for plant growth—without needing to set-up costly and cumbersome in-situ sensors.
You may ask yourself, how is it possible to gain such detailed information on different characteristics of their crop?
By using EO data on a local scale and feeding this knowledge into water and energy balance algorithms. From an increase in yield to more sustainable and efficient use of freshwater resources, the results of leveraging TIR for agriculture can be highly valuable.
Flash drought prediction
Extreme weather conditions can severely impact our ability to produce sufficient food for a growing world population.
With high spatio-temporal TIR data, analysts can simultaneously access top-level and root-level soil moisture content, thereby supporting timely predictions and actions against droughts.
Further applications of land surface monitoring include disaster and environmental monitoring as well as urban and infrastructure monitoring:
Climate change monitoring
LST data is one of the most critical climate variables for climate change studies.
Earth's average surface air temperature has increased by about 1 °C since 1900, with over half of the increase occuring since the mid-1070s.
The 10 warmest years on record have all occurred since 1998—with 9 of the 10 having occurred since 2005. The year 2019 was among the top three warmest years on record.
By 2020, models predict that global surfce temperature will be more than 0.5°C (0.9°F) warmer than the 1986-2005 average, regardless of which carbon emissions path the world takes.
Thermal infrared data collected by EO satellites are used to accurately monitor temperatures at a global scale and over extended time scales.
Doing so enables us to keep track of how, when, and where our planet is warming and cooling.
Leveraging LST data to understand environmental conditions means that we can observe warming trends and create models to understand and predict how fast the planet is warming and prioritize mitigation efforts where needed.
 Changes in global average surface temperature from 1990-2019. Places that warmed by up to 1° Fahrenheit over the past 30 years are red, places that have cooled by up to 1° F are blue, and places where we don't have enough observations to calculate a trend are light gray. Source: NOAA Climate.gov map, based on NCEI data).
Disaster monitoring
The world’s growing population is more vulnerable to natural disasters due to the climate crisis.
Advanced TIR data products help with early-stage hazard detection of wildfires, volcanic eruptions, earthquakes, droughts, and other small and large scale temperature anomalies.
For example, thermal instruments monitor the high temperature of active fires—enabling burned area mapping, wildfire tracking, and early detection.
Land Surface Temperature information can actively support local authorities in preparing and conducting appropriate countermeasures for disasters worldwide.
Water quality monitoring
With LST data, we can connect the surface temperature of inland water bodies to disease evolution and spread.
High-resolution TIR data can be used to model water quality and timely forecast epidemic propagation vectors.
Water temperature is also an important indicator of overall water quality assessment.
LST-based explorations of the differential between water surface vs. land surface temperature can detect anomalies and trends in water quality and how this relates to temperature.
Urban Heat Island detection
Urban Heat Islands or UHIs are a serious threat to the health of our increasingly urban society.
Manifested when a city experiences much warmer temperatures than nearby rural areas, urban heat islands are an increasingly typical feature of the urban world that we live in.
With over half of the population living in cities—UHIs exacerbate the risk of heat-related mortality associated with global climate change.
High-resolution TIR data can help to identify UHIs, as well as quantify the effectiveness of countermeasures in smart cities.
Infrastructure monitoring
In an increasingly interconnected world, the condition and maintenance of infrastructure are of immense importance.
Infrastructure is vulnerable to extreme weather events and temperature fluctuations.
From rail lines to power lines, temperature variations can impact infrastructural integrity. Infrared technology such as ConstellR’s enables us to monitor sensitive infrastructure day and night.

Summary
To summarize, land surface temperature monitoring or LST monitoring is an incredibly useful way to monitor Earth's temperature by measuring the thermal infrared radiation it is emitting.
LST data measurements have many applications—from climate change and crop management to wildfire monitoring and urban heat island detection.
While we can surely be proud of what we observe and learn from the current EO systems every day, we are in for an exciting new view of our planet in the future.
Shifting our (spectral) focus to the far end of infrared radiation—and exploring thermal infrared radiation in even more detail than ever before.
Ready to use LST data and more? Sign up to UP42 and explore geospatial data and processing algorithms today.


