A version of this post was originally published by Geoawesomeness on 12 June, 2020.
Life amidst the COVID-19 pandemic has been somewhat surreal. Though I have been fortunate enough to be able to work from home during these unusual times, certain aspects of sheltering-in-place have felt palpably more bizarre – such as listening to birds instead of the car traffic during the morning ‘rush hour’.
Wanting to capture this strange moment in time, I set about to find a way to measure the impact of the novel coronavirus on my neighbourhood. Having done a fair bit of research on how COVID-19 was influencing mobility patterns all over the world already, there were a few good options.
From the geospatial science perspective, the most generic way to model it would be to measure the spatial aspect of the impact based on ground sensors such as mobile phones. Unfortunately, such datasets are reserved for the big players in the industry such as Google, Facebook, TomTom, HERE, or Mapbox. Satellite data, on the other hand, is much more accessible (even in high-res) if you know where to look.
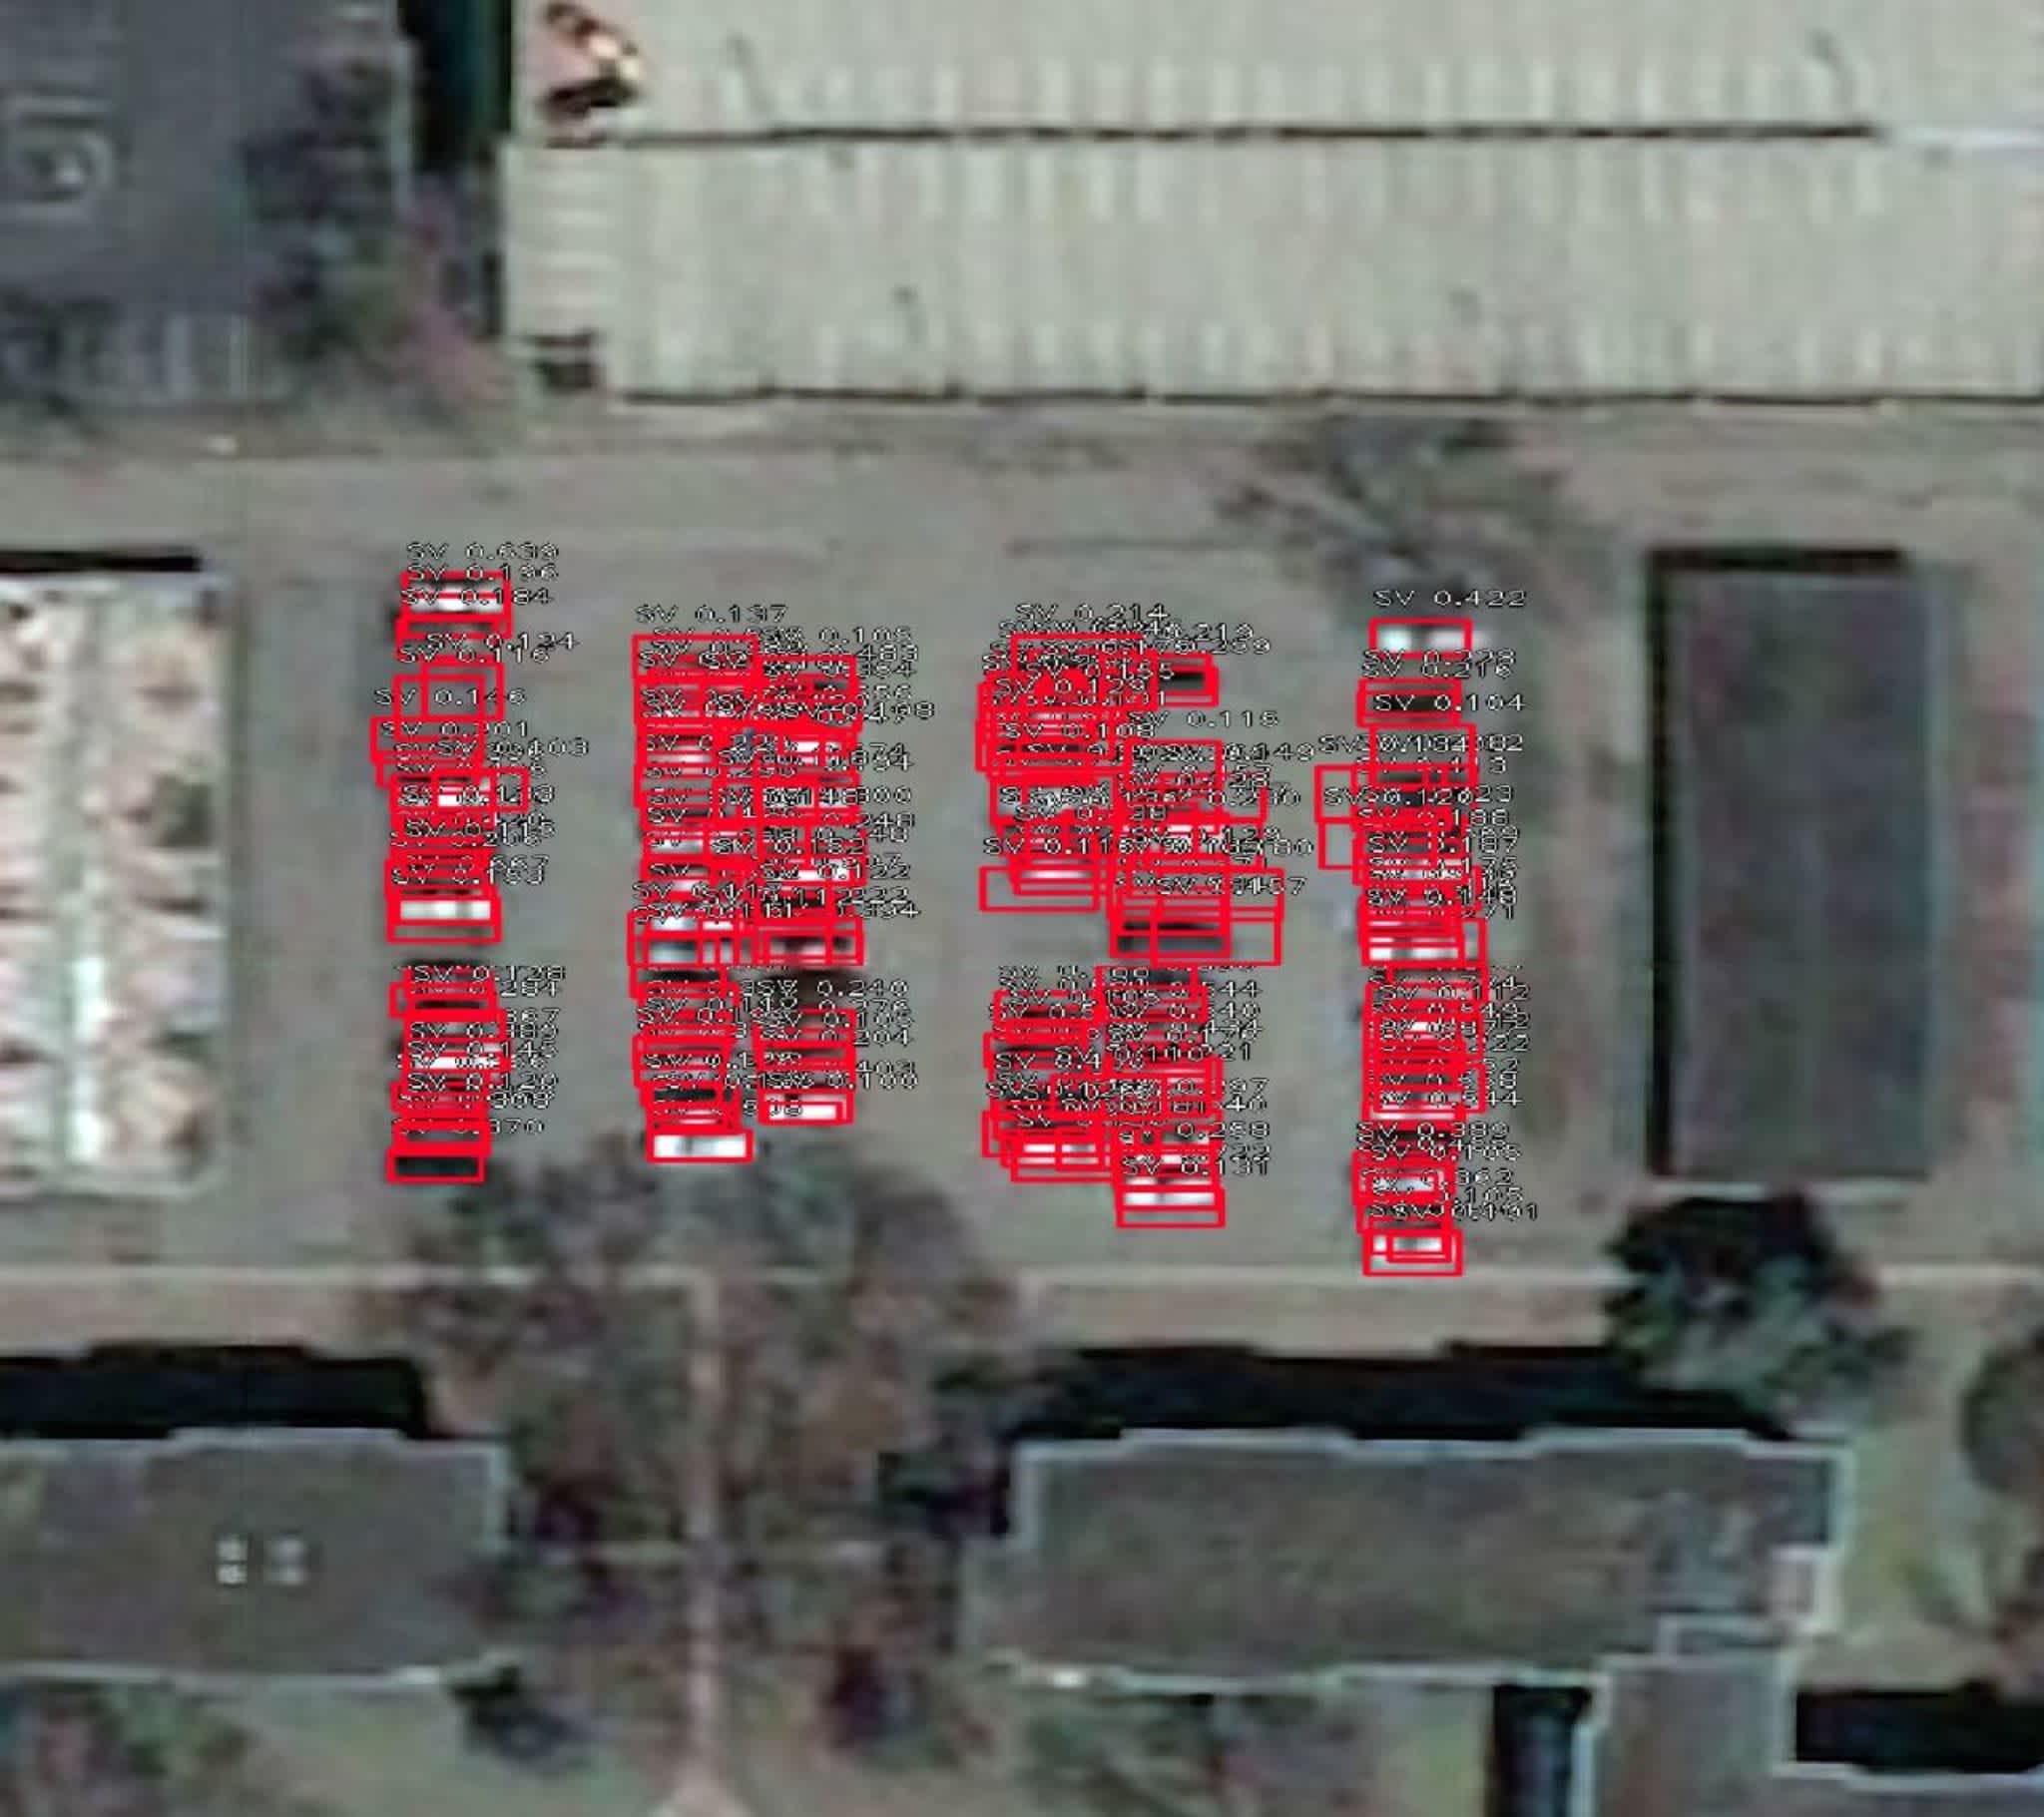
I decided to analyze the change in the number of cars detected in an area as my unit of measurement. It’s not a perfect metric, but in principle, it should give fairly reasonable results for a larger urban area.
Now I had to find access to satellite data and object detection algorithms which I would be able to deploy quickly and effectively. In the past, I have been playing around with ArcGIS Pro Deep Learning toolbox but my 60-day trial expired, and buying a subscription is far too expensive for an individual. Also, I was looking to run a DIY geospatial experiment on a weekend using something that had the complexity I need, while being accessible.
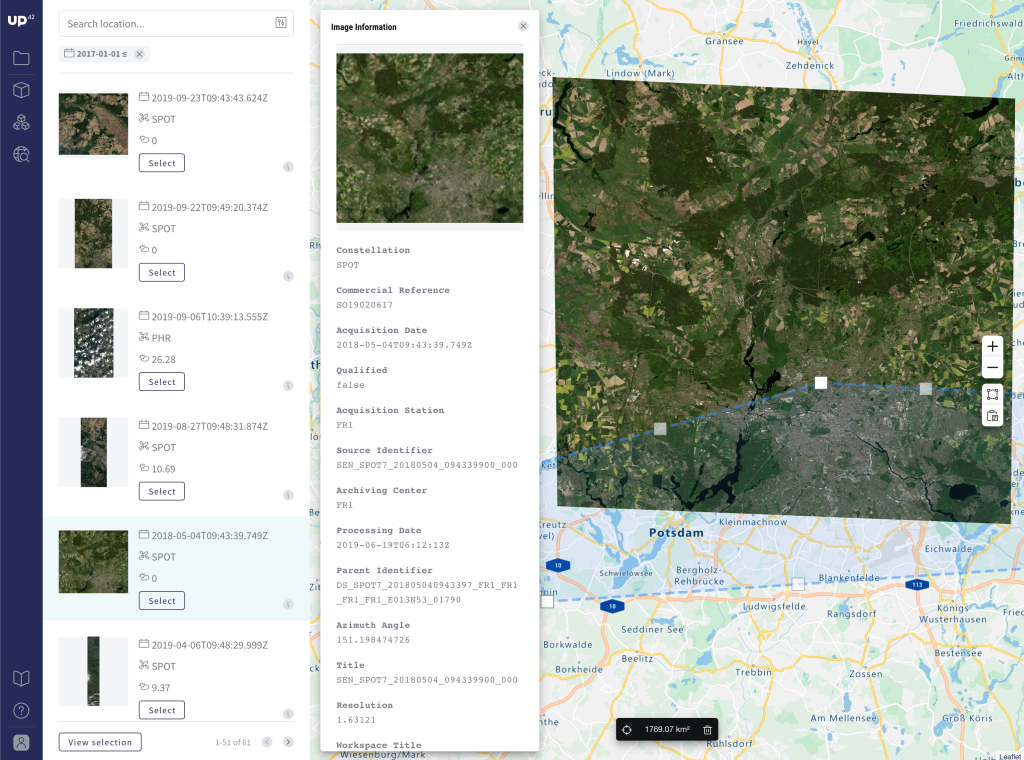
After a bit more searching around, I stumbled upon UP42, who we have covered a few times on Geoawesomeness. The startup is a marketplace for geospatial data and dozens of analytical algorithms, where you simply combine blocks with data sources and algorithms and run the analytics directly in the cloud.
One of the pre-build algorithms I found is the small vehicle detection model, so exactly what I was looking for. Additionally, UP42 gives you some free credits to get started which should let you analyze at least a few squares kilometres worth of satellite data. Now I was good to go!
I selected around 1 sq km area around the temporarily-closed Mall of America in Bloomington, Minnesota, as my test location.


It took me around 15 mins for the setup of the blocks on the UP42 platform and ~1h of data processing in the cloud, and again 15 mins to analyze the results.


Overall, I’ve learned that year-to-year (April 16, 2019, to April 19, 2020) the number of vehicles parked and driving around the area has dropped around 3 times!


To make the analysis scientifically correct, I should be looking at a longer observation period to account for different hourly and weekday patterns. However, I believe that even data from a simple model is better than no data at all! So check out the following simple and straightforward method to measure the geospatial impact of COVID-19 in a neighbourhood — for free.
The whole experiment took me about an hour + some idle cloud processing time and I ended up using only about 3,000 of my 10,000 free credits. Pretty awesome, right?
Read the original article on Geoawesomeness to see the full tutorial and map the impact of COVID-19 in your neighborhood.


