An introduction to zonal statistics

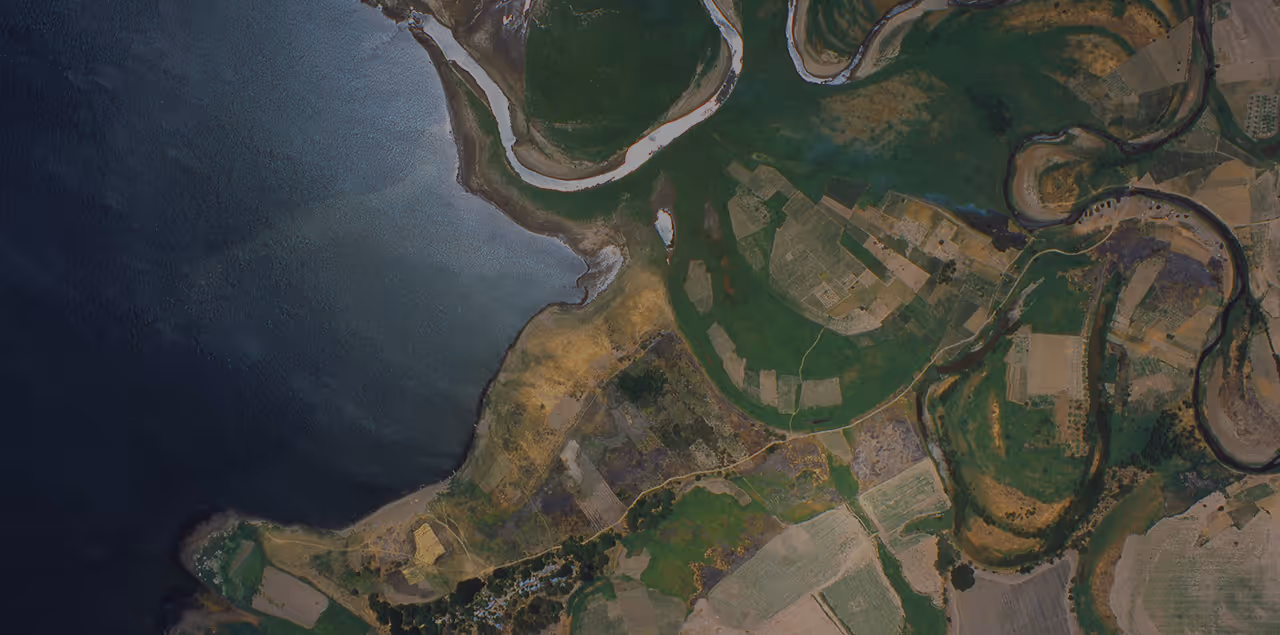
The Earth's surface is complex. No two locations are exactly the same.
However, based on certain attributes, there are spatial similarities: areas of the same land use, soil type, vegetation type, elevation, climate, economic development, and so on.
These similarities enable us to identify and define zones, which are characterized by internal uniformity within a zone but with significant differences between zones.
Zones (also known as classes or regions) generalize the Earth's surface. They make the Earth's diverse surface more understandable through spatial summaries, i.e., zonal statistics.
What are zonal statistics and why are they important? What are their application areas and which tools can you use for zonal statistics? In this article, we answer these questions.
What are zonal statistics?
Zonal statistics are statistics calculated from the values of raster cells falling within zones defined by another raster or vector dataset. Zonal statistics summarize the values of a particular group of cells. On a side note: raster cells refer to a grid-like method of representing an area, and will be explained in more detail later in this article.
Examples of summary data obtained through zonal statistics include mean, median, count, standard deviation, and sum. In short, zonal statistics give us an idea of the statistical characteristics of a particular zone, e.g., average temperature by land-use/land-cover type.
The outputs of zonal statistics are attached to all the cells corresponding to a particular zone. Therefore, cells falling within a common zone have the same raster cell values. This means that an individual cell in a zone is assigned the characteristics of the zonal area.
Why are zonal statistics important?
Zonal statistics are useful for comparison between zones–and sometimes between different cells in a zone. They are also a convenient way to monitor trends and assess progress over time across various zones or geographical regions.
Considering the previous example, we can use zonal statistics to show differences in average temperature between land use-land cover types.
What datasets are required for zonal statistics?
From the above discussion, we can deduce that to compute zonal statistics, we need two inputs:
- A raster layer containing the values to be analyzed (Let's call this the input raster). Examples include temperature, rainfall, elevation, and soil nitrogen content. Zonal statistics are usually computed based on input raster data values.
- A raster/ polygon layer defining the zones (Let's call this the zone layer). Examples include land use categories, soil types, vegetation types, building footprints, and administrative boundaries. If the zone layer is a raster, the cells must represent a discrete class, e.g., a land cover type, as opposed to a continuous value.
The output of zonal statistics is a new raster or table containing the summary statistics of the input raster for the zones defined by the zone layer.
Before we look at the applications of zonal statistics, let us take a step back and define what we mean by raster data and zones.
What is raster data?
Raster data is data stored in a regular grid format using a series of cells (often square-shaped) known as pixels. Each cell has a value representing some characteristic of the Earth's surface.
The pixel size determines the spatial resolution of the raster image. For instance, a pixel of dimensions 30m by 30m represents a 30 by 30m area on the Earth's surface. Such an image has a 30m spatial resolution.
Raster data is suitable for representing spatially continuous data that changes across the landscape—and is therefore challenging to depict using vector data. Examples of continuous data include slope, elevation, rainfall, and temperature.
Nevertheless, discrete data can also be stored in a raster format. Discrete rasters capture categorical data, such as land cover type, soil class, etc. In other words, the pixel values represent a specific theme or class. Usually, the values of discrete rasters are integers that represent different categories, e.g., 0 for shrub lands, 1 for ice, 2 for savanna, 3 for a water body, etc., in a raster depicting land cover types.
Raster data can be created by:
- Data capture using a camera or sensor, e.g., aerial and satellite imagery.
- Computation using geospatial analysis tools, e.g., interpolation of point elevation data to create a raster elevation model, or land cover classification to create a classification image.
We can perform analyses on raster data at the individual cell level or a group of cells (i.e., in a zone).
What are zones in zonal statistics?
Zones are areas with homogeneous characteristics. Given the diverse nature of the Earth's surface, there can be as many potential zones as there are physical, cultural, or economic attributes of an area.
Zones are, therefore, selected based on attributes or variables that are important for analyzing the topic or problem at hand. For example, to study the effects of elevation on forest type, we define zones based on forest type.
Zones are such that the differences in cell values between different zones are greater than the differences observed within the same zone. Zones can be connected, disconnected, or both. Examples of zones include:
- Land-use/ land-cover types
- Administrative districts
- Urban planning zones
- Watershed polygons
What are some applications of zonal statistics? Let us find out.
Zonal statistics application examples
Zonal statistics in precision agriculture
Agriculture is crucial for human life. It is a source of food, fuel, and raw materials, among others. With the changing climate and rising population, there is a need for sustainable agricultural practices that optimize outputs while protecting the environment.
Spatial and temporal variability in soil characteristics, surface temperature, fertilization, irrigation, seed variety, etc. leads to varying crop growth rates, health, and yield. How do we sort through these factors to determine their relationships and make informed field management decisions? Zonal statistics can help.
First, we need to define homogeneous field areas (zones). We can identify zones based on characteristics like elevation, rainfall, soil maps, or satellite data-based indices representing soil moisture characteristics, crop properties, or yields.
Thereafter, we can compute zonal statistics to gain insights into the spatial and temporal inter- and intra-field variations in crop growth and productivity.
In precision agriculture, zonal statistics can help to determine:
- Characteristics of high productivity zones
- How a specific seed variety performed across different zones
- Effectiveness of fertilization or irrigation practices
- Crop health
- Mean soil moisture in a field
Want to find out more about remote sensing and zonal statistics in agriculture? Watch our webinar on the future of farming.
Zonal statistics in wildfire hazards and disaster assessment
While wildfires may benefit ecosystem restoration, they threaten human lives, infrastructure, and the environment. To mitigate the risks, it is important to undertake a wildfire risk assessment.
To do this, we may need to relate historic wildfire incidents to land cover type, topography, slope, etc. In addition, we could examine historic wildfires against population density to determine if human activities also contribute to wildfires. Extracting these insights calls for the application of zonal statistics.
In wildfire hazards and disaster management, zonal statistics could provide answers to questions like:
- Which areas are more at risk?
- How many people live in high-risk areas?
- Which land cover types are more susceptible?
For example, the USDA Forest Service used zonal statistics to aggregate wildfire hazard potential map data by administrative zones. This could inform state-specific risk mitigation measures.
For a step-by-step example, check out this tutorial that uses zonal statistics to compare wildfire risks in different parks.
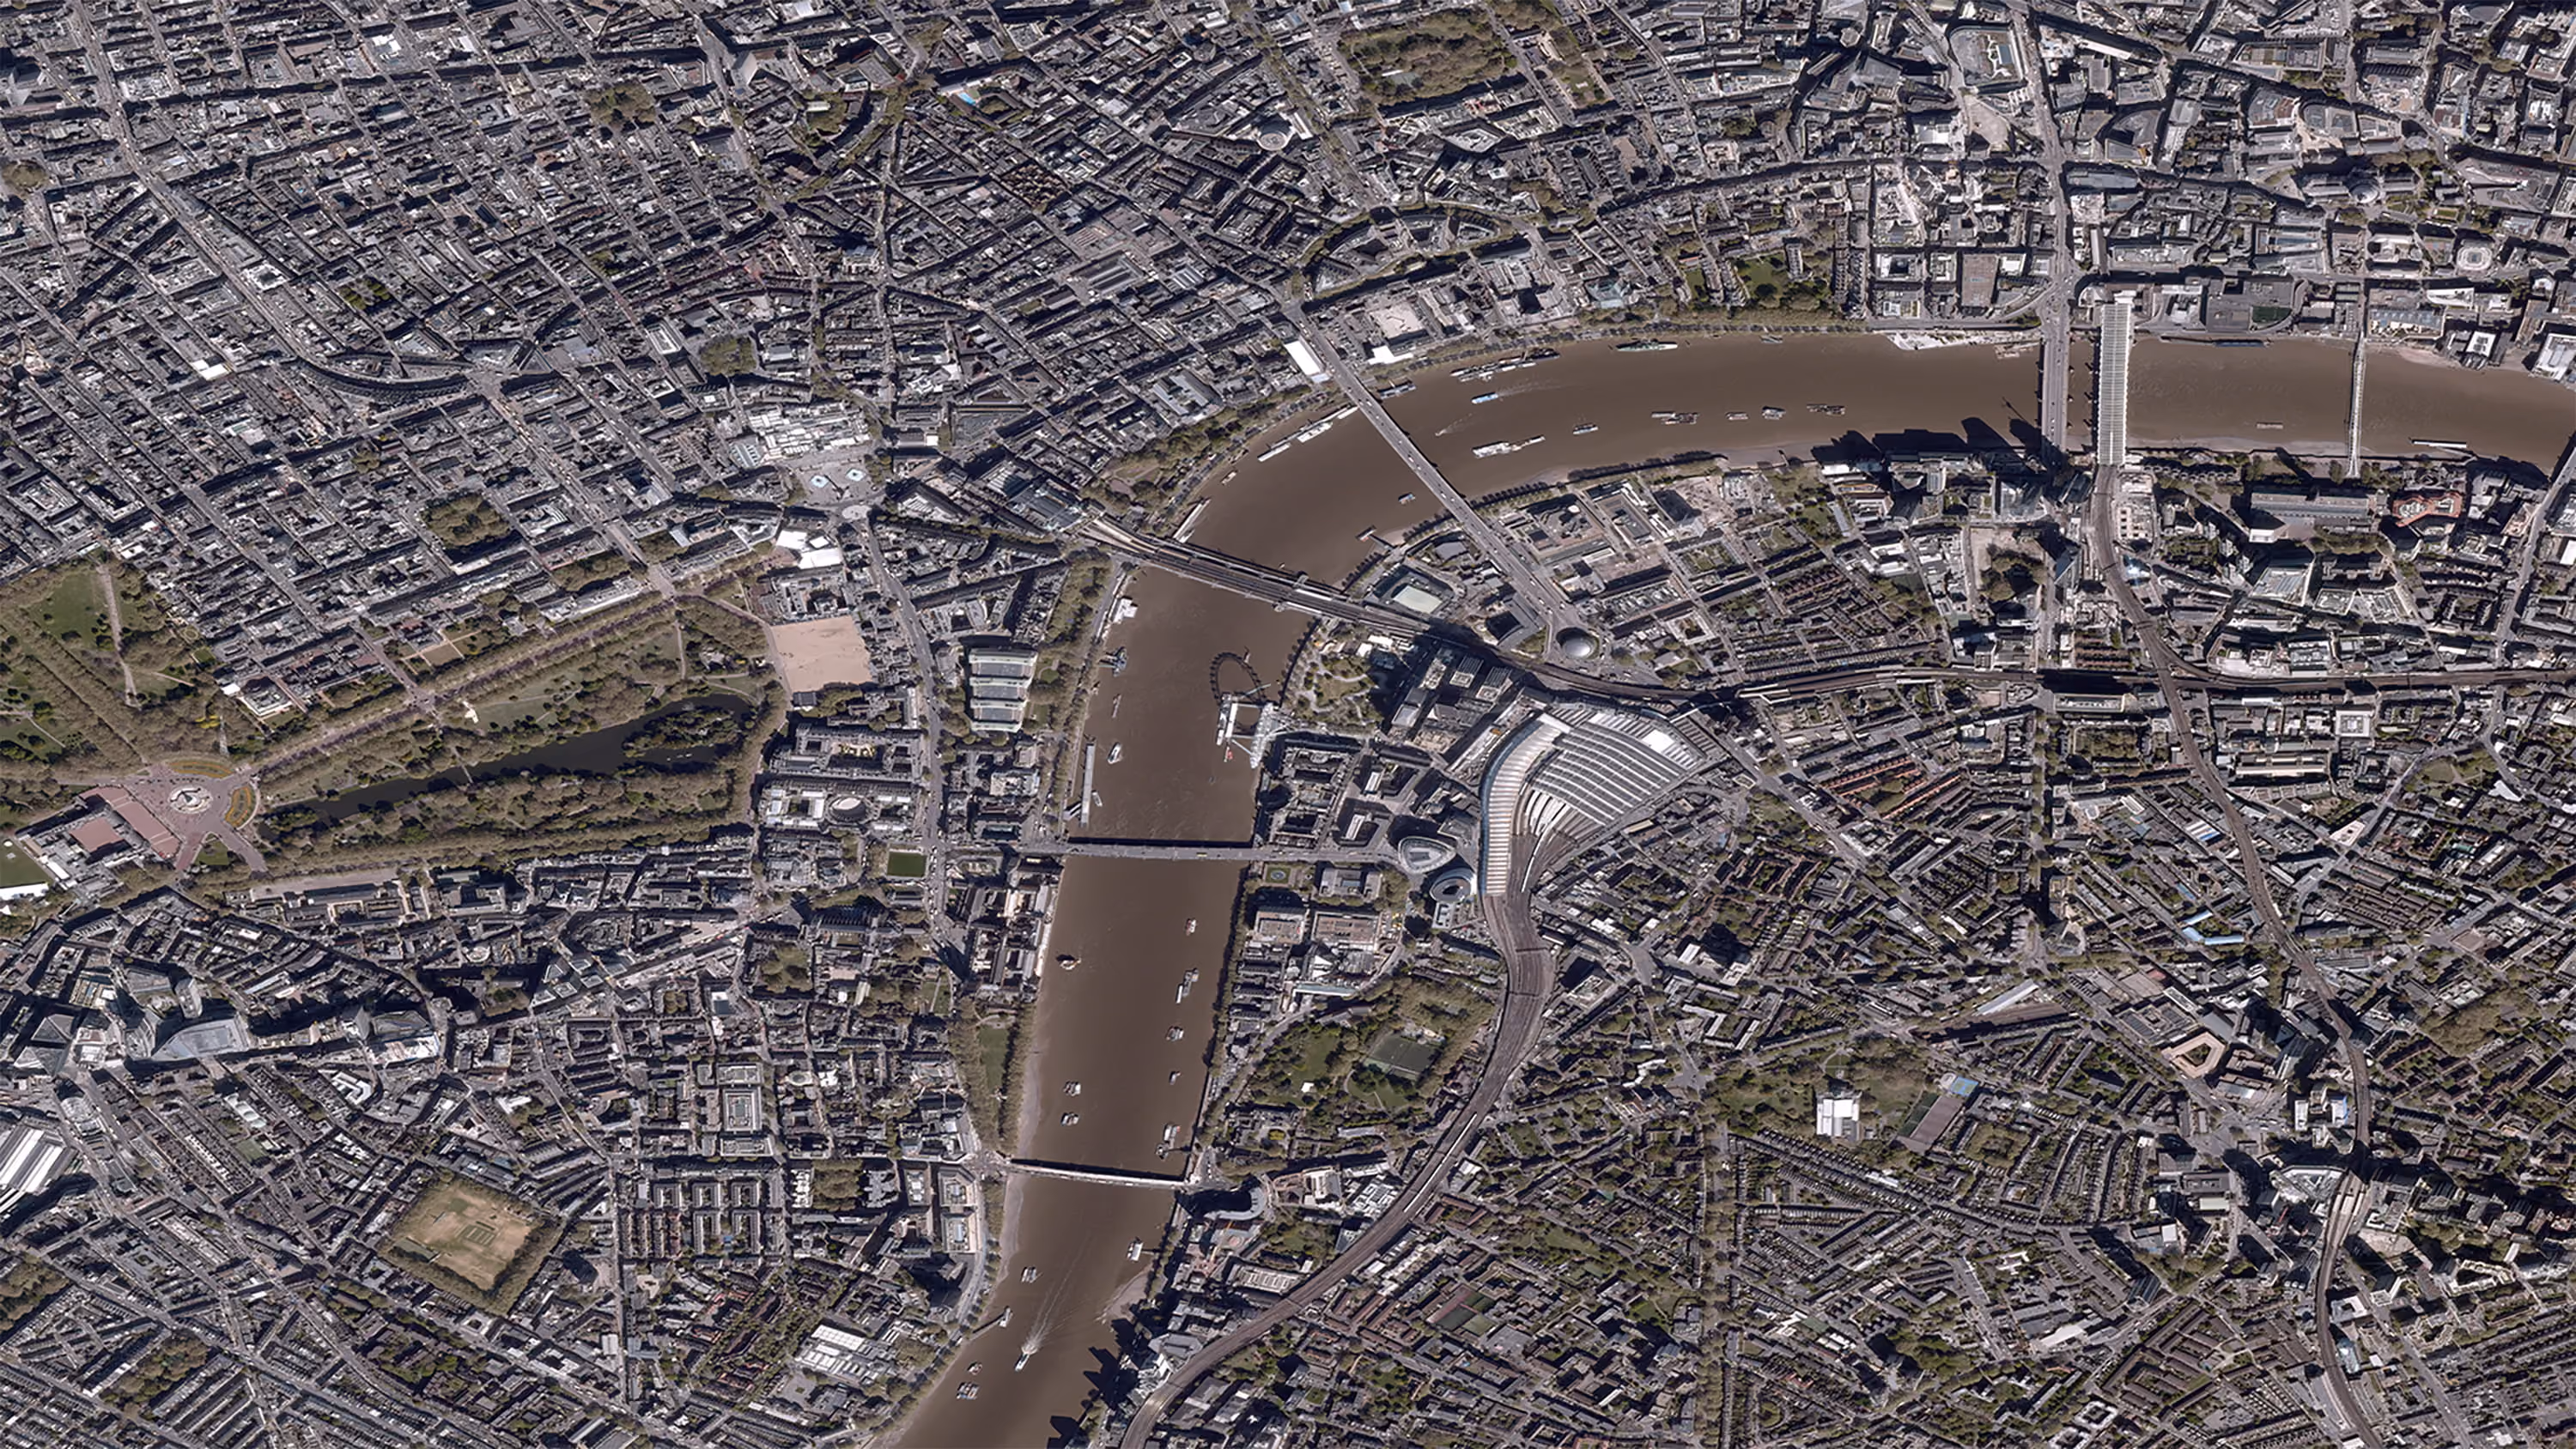
Zonal statistics in studying the effects of urbanization on surface temperatures
Structures like roads, buildings, and parking lots characterize urban areas. Such built-up areas exhibit higher temperatures than the surrounding natural landscapes–a phenomenon known as an urban heat island effect. Higher temperatures lead to heat waves, higher energy costs, altered hydrological cycles, etc.
Here, zonal statistics of temperature by land cover category (e.g., mean surface temperature by land use) are used to understand temperature variations within cities. Such data are useful for monitoring the effects of urbanization, for climate change, and for gauging the effectiveness of intervention measures.
Aside from using land cover to examine the urban heat island effect, other studies have applied zonal statistics to correlate population density with temperatures. The assumption is that a higher population density means fewer vegetated spaces, leading to higher surface temperatures.
Additional application examples of zonal statistics
- Investigating the effect of slope on different land use or vegetation types. Here, the average slope may be extracted over different land use classes.
- Identifying slope characteristics in different watershed areas.
- Forecasting the number of people vulnerable to severe weather (e.g., cyclones) and sea level rise for decision support and risk reduction.
- Determining the number of people within a specific distance from a hospital.
- Computing the average green space per urban planning zone.
- Field-level crop risk assessment based on indicators like crop health, soil moisture content, and weather.
Where can you access zonal statistics tools?
Zonal statistics in ArcGIS Pro
Just like QGIS, the zonal statistics tool in Esri's ArcGIS Pro extracts statistics on a raster layer based on zones defined by a polygon layer or another raster layer.
ArcGIS Pro has two tools for computing zonal statistics:
- Zonal Statistics: Results in a raster
- Zonal Statistics as Table: Results in a standalone table with summary statistics for each zone
Both options are accessible via the Spatial Analyst geoprocessing tool.
With the UP42 ArcGIS Pro Add-in, ArcGIS Pro users can now access UP42 storage and projects without leaving the Esri ecosystem. You can find out more and download the add-in directly here.
Zonal statistics in QGIS
Several zonal statistics tools are available via the QGIS Processing Toolbox. Depending on the tool, QGIS calculates zonal statistics on a raster layer based on:
- Raster areas that overlap with a polygon layer
- Zones defined in a discrete raster layer
There are plenty of online tutorials on using the QGIS zonal statistics tools. Here's a tutorial that walks you through zonal statistics with a raster-raster or raster-vector combination.
Zonal statistics on UP42
In the future, you can also use the UP42 Raster Zonal Statistics processing block (currently under redevelopment) to extract information from your raster data.
For example, in the image below, the processing block was used to compute the average Normalized Difference Vegetation Index (NDVI) values for several fields. NDVI values tell us more about the state of vegetation health, with higher values representing healthier plants.
More tools for computing zonal statistics
Sometimes, you may need to extract zonal statistics without additional software, compute statistics that are not yet available in GIS software, or simply automate repetitive analyzes. Below is a list of other options you can explore in these circumstances:
- Zonal statistics in R: With statistical analysis, modeling, and visualization capabilities, we can use R language to extract zonal statistics, e.g., through the 'zonal' function.
- Zonal statistics in Python: Python is a useful language in GIS, since most GIS software provides the option to undertake analysis using Python scripts. Here is a helpful tutorial on zonal statistics in Python.
Want to learn more about zonal statistics with UP42? Just reach out—our sales team would be happy to answer your questions.

Subscribe to our newsletter
Stay up to date and learn about our fast-growing new features