Change detection: How to use the UP42 platform to analyze landslides
The fatal landslides in the district of Wayanad (in the southern Indian state of Kerala) happened during the early hours of 30 July 2024. Apart from the tragic loss of human lives, the landslides caused significant damage to wildlife, livestock, and the region’s topography. Studies conducted after the event revealed that extremely heavy rainfall over a short period was a key catalyst. It was the third heaviest one-day rainfall event ever recorded in Kerala.
In this post, we’ll use satellite imagery for change detection, to assess vegetation loss caused by these landslides. After downloading the imagery through UP42, we’ll analyze the changes using both QGIS and Python SDK.
Ordering pre- and post-event imagery
At UP42, one of our core tenets is to make it easy for any organization doing analyzes like these, by granting quick access to the necessary data. This is often complicated during emergency response, because you end up needing precise data over an exact AOI (Area of Interest), while also staying within budget.
As the starting step, let’s go to Catalog within the UP42 platform, where we can search for archive imagery covering our AOI. As we can see, there’s a bunch of different datasets of varying resolutions and prices, giving us a lot of flexibility.
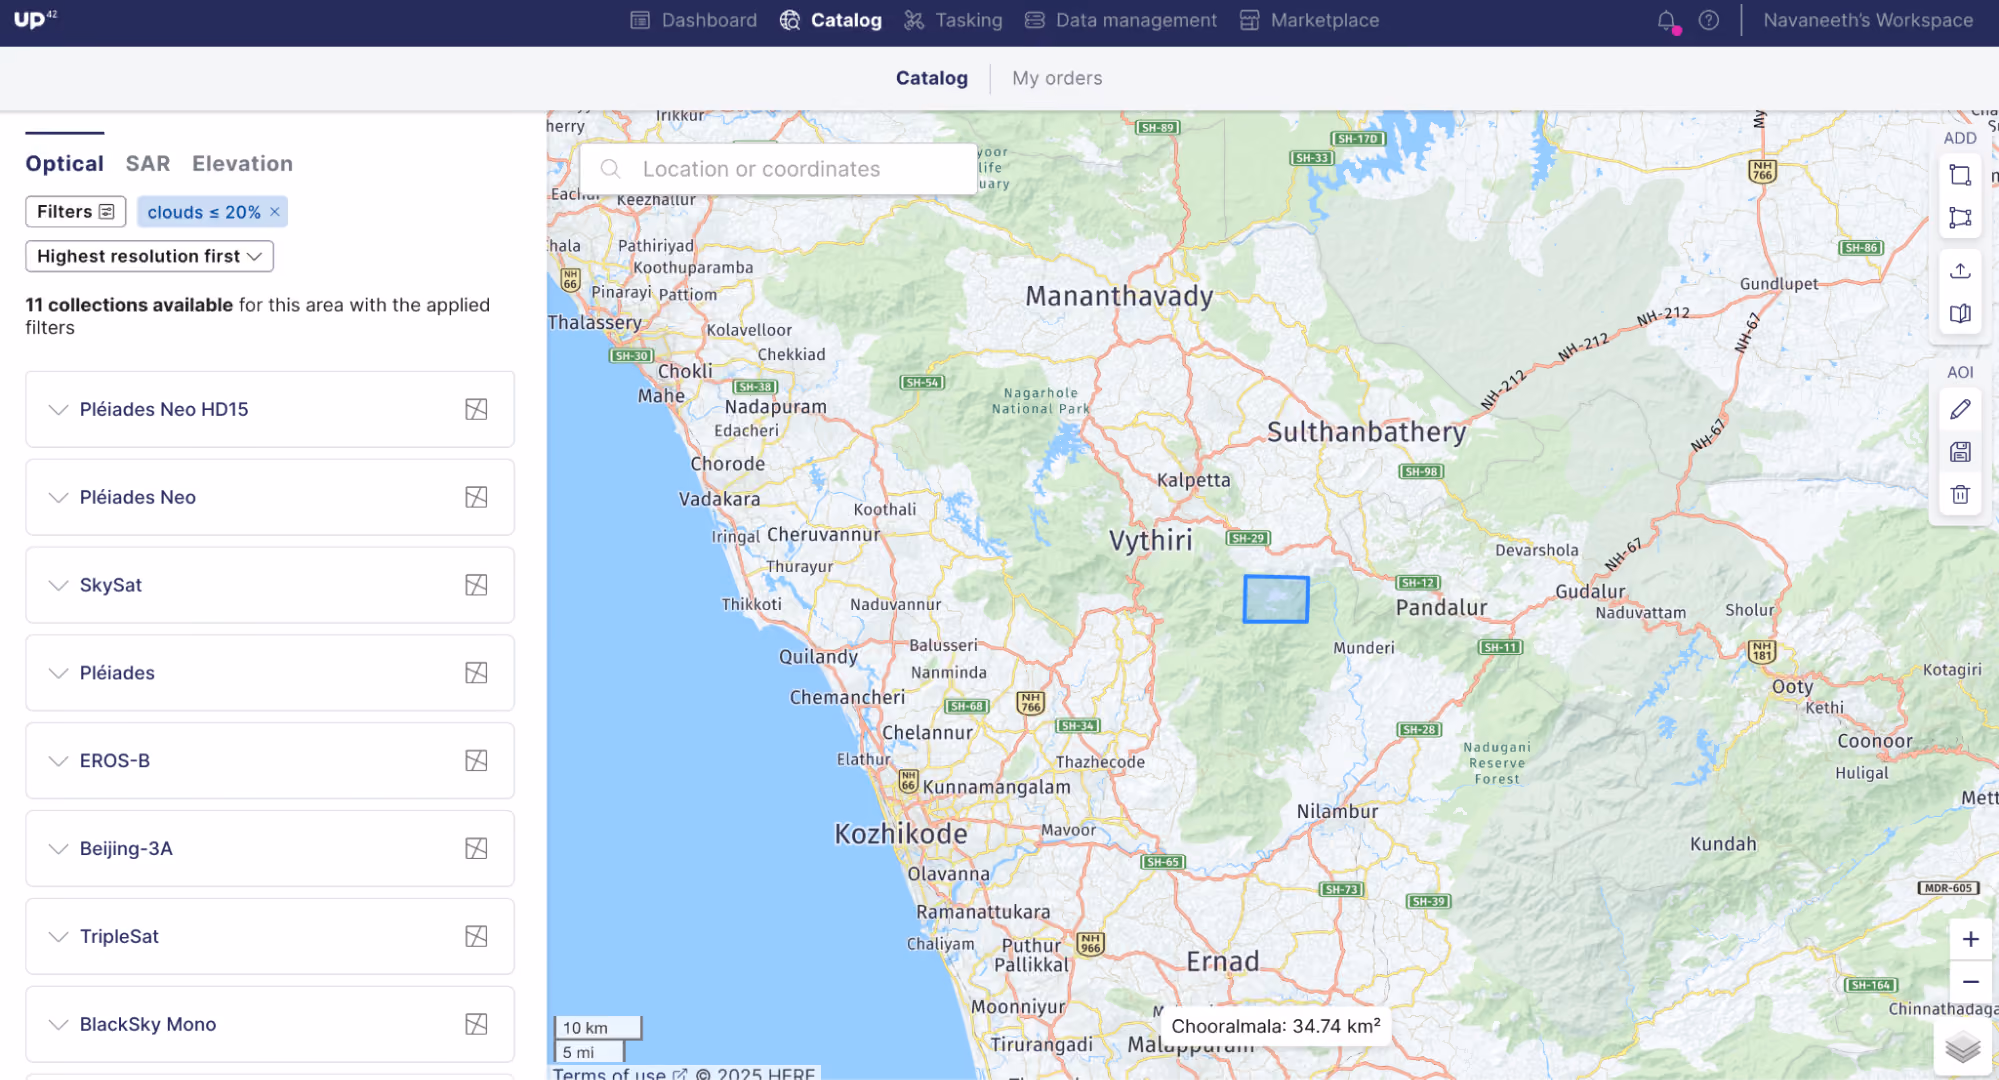
UP42 catalog for ordering archive imagery
NDVI calculation
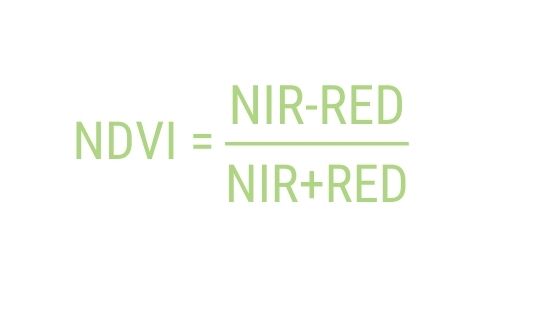
Our goal is to analyze vegetation loss caused by landslides within our area of interest (AOI). To achieve this, we’ll use the Normalized Difference Vegetation Index (NDVI), a widely used metric for assessing vegetation health and density. NDVI uses the difference between red and near-infrared (NIR) bands to generate a single representative value, making it a powerful tool for detecting changes in vegetation over time.
To perform the NDVI calculation, we need a pre- and post-landslide image over our AOI. We’ll use the UP42 catalog to order these images.
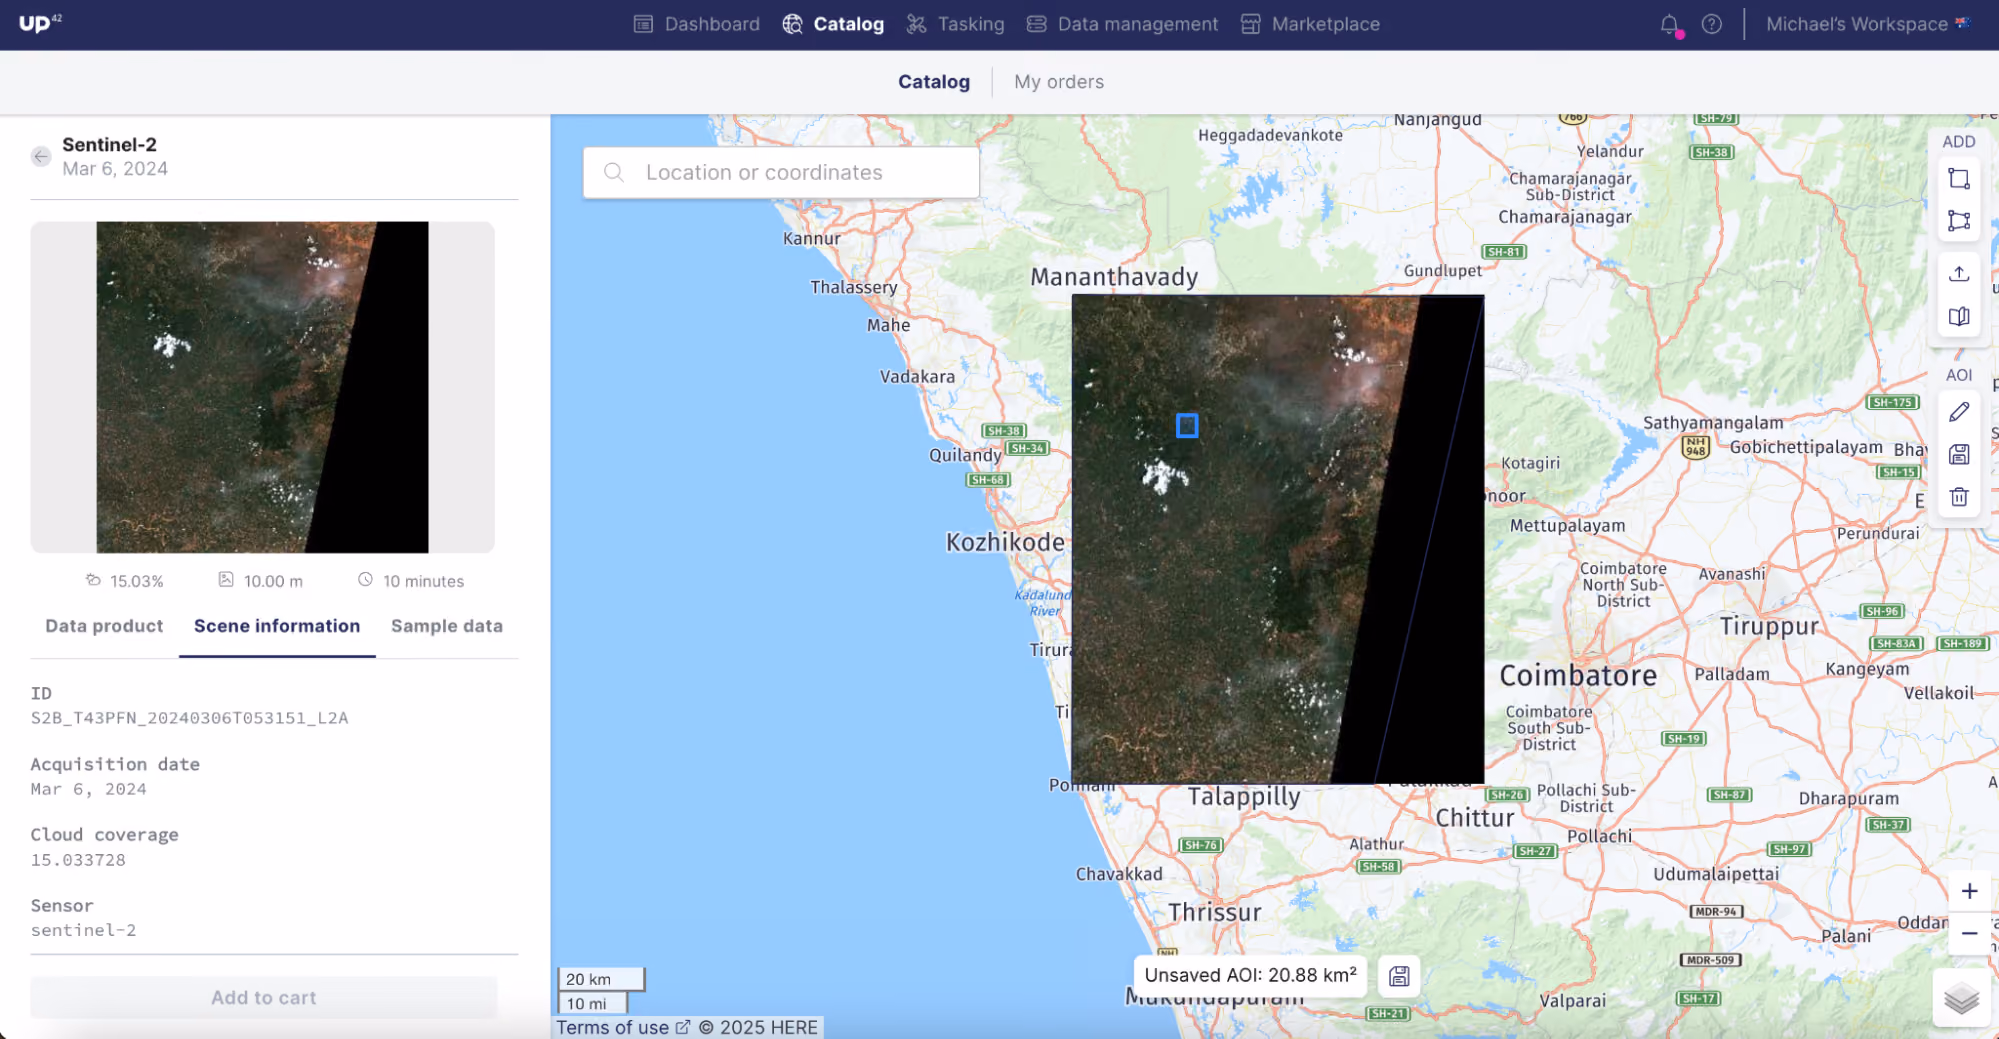
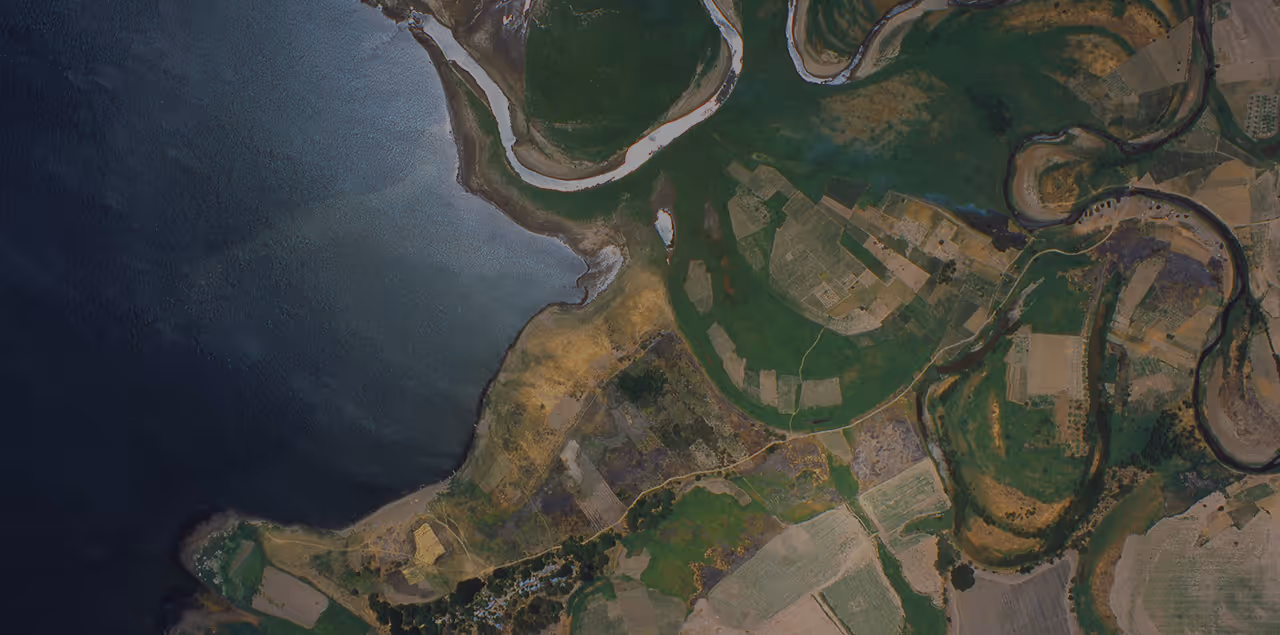
Sentinel-2 image from March 6, 2024 over Wayanad
We can find two different Sentinel-2 images over Wayanad, from March 2024 and January 2025. The Sentinel-2 collection is available for free download through UP42, and offers a resolution that’s suitable enough to carry out our NDVI analysis.
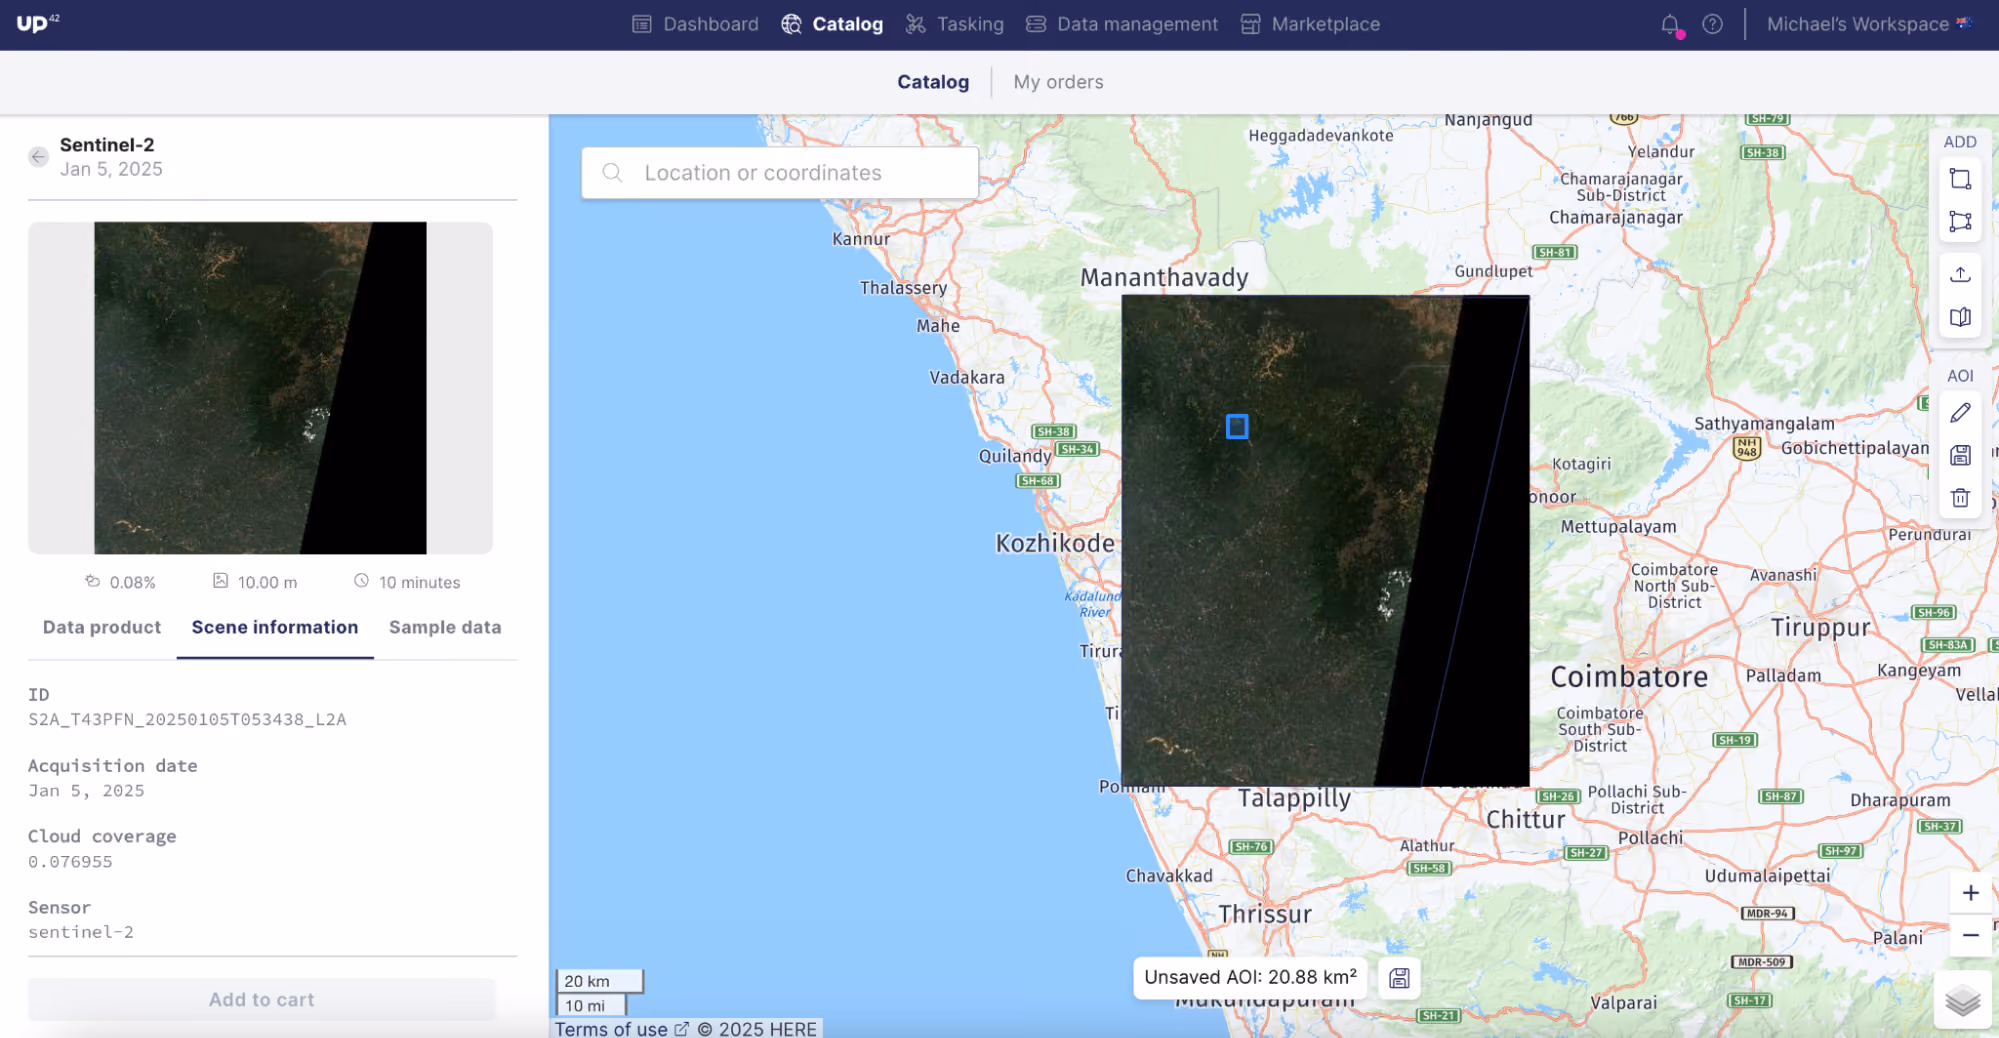
Sentinel-2 image from January 5, 2025 over Wayanad
Ordering imagery is a quick process, and the data management space within the UP42 platform gives you a centralized view of all your downloaded imagery. UP42 makes it really easy for you to download imagery directly, or stream downloaded data into your pipelines or 3rd party tools.
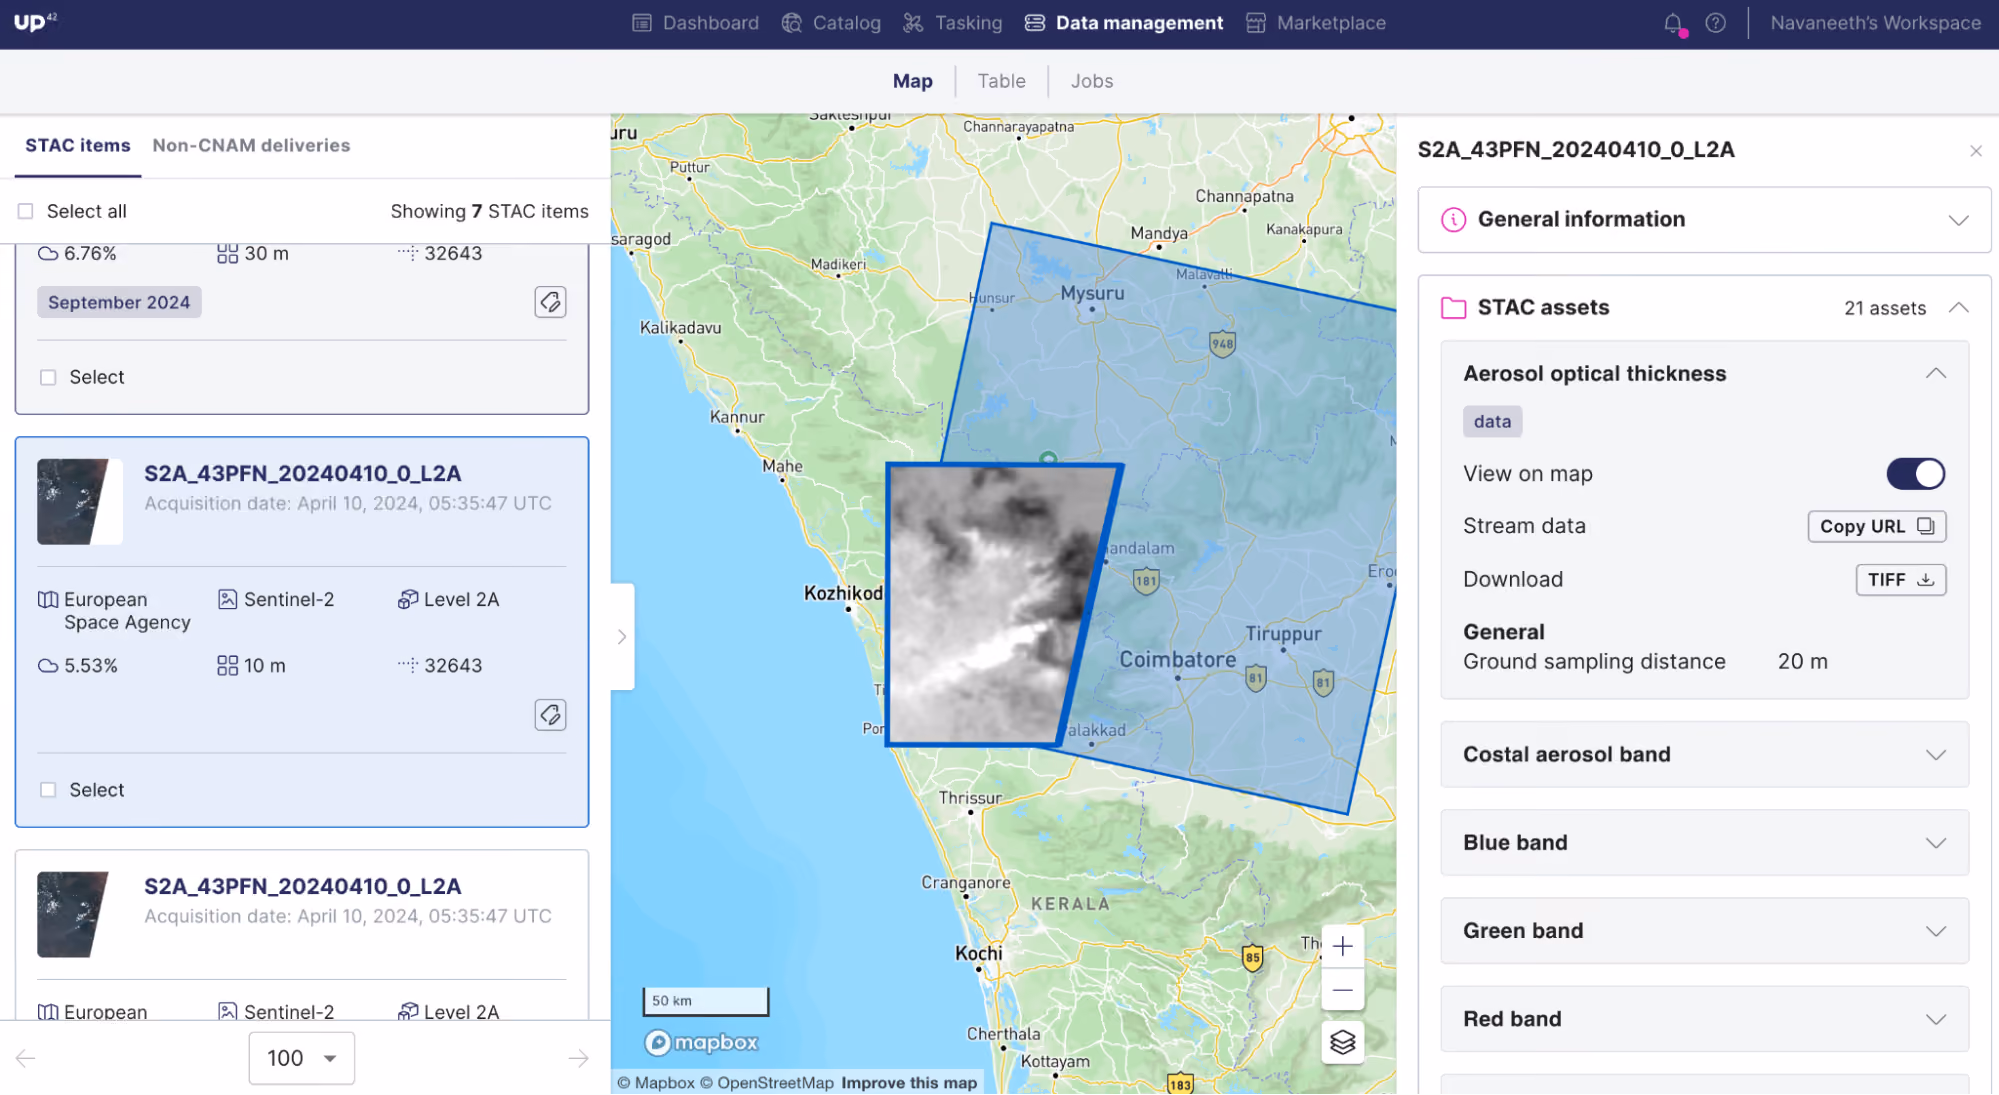
UP42 data management space
Once you’ve downloaded the images, you can calculate NDVI in two ways:
1. Using QGIS: Import the images into QGIS and use its built-in NDVI calculator.2. Using code: Process the images programmatically with the UP42 Python SDK.
1. NDVI calculation using QGIS
In the first method, we upload the images into QGIS, calculate the NDVI, and visualize the changes in NDVI between the images. Let's go through it step-by-step.
Step 1: After uploading the images, we use the in-built NDVI calculator within QGIS to calculate the NDVI value for each image. We get two NDVI rasters, as we can see below. The red box indicates our AOI.

NDVI rasters in QGIS
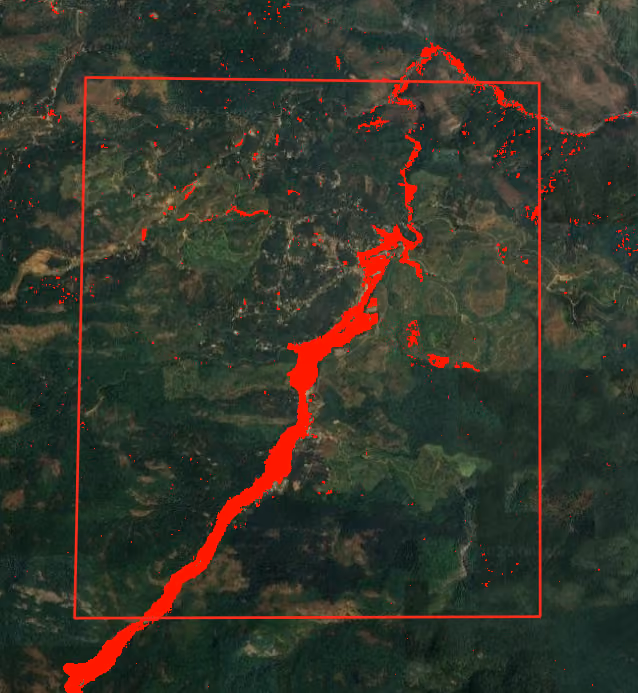
Step 2: To identify changes caused by the landslide, we compute the NDVI differential using the Raster Calculator tool in QGIS.

NDVI differential
Step 3: Reclassify NDVI Differential
To make the results easier to interpret, we can reclassify the NDVI differential raster into two categories:
- Areas with significant vegetation loss (ΔNDVI≤−0.1): Classified as landslide-affected regions.
- All other areas (ΔNDVI>−0.1): Classified as non-affected regions.
We assigned red to landslide-affected areas to visually highlight the damage, and make unaffected areas green or transparent.
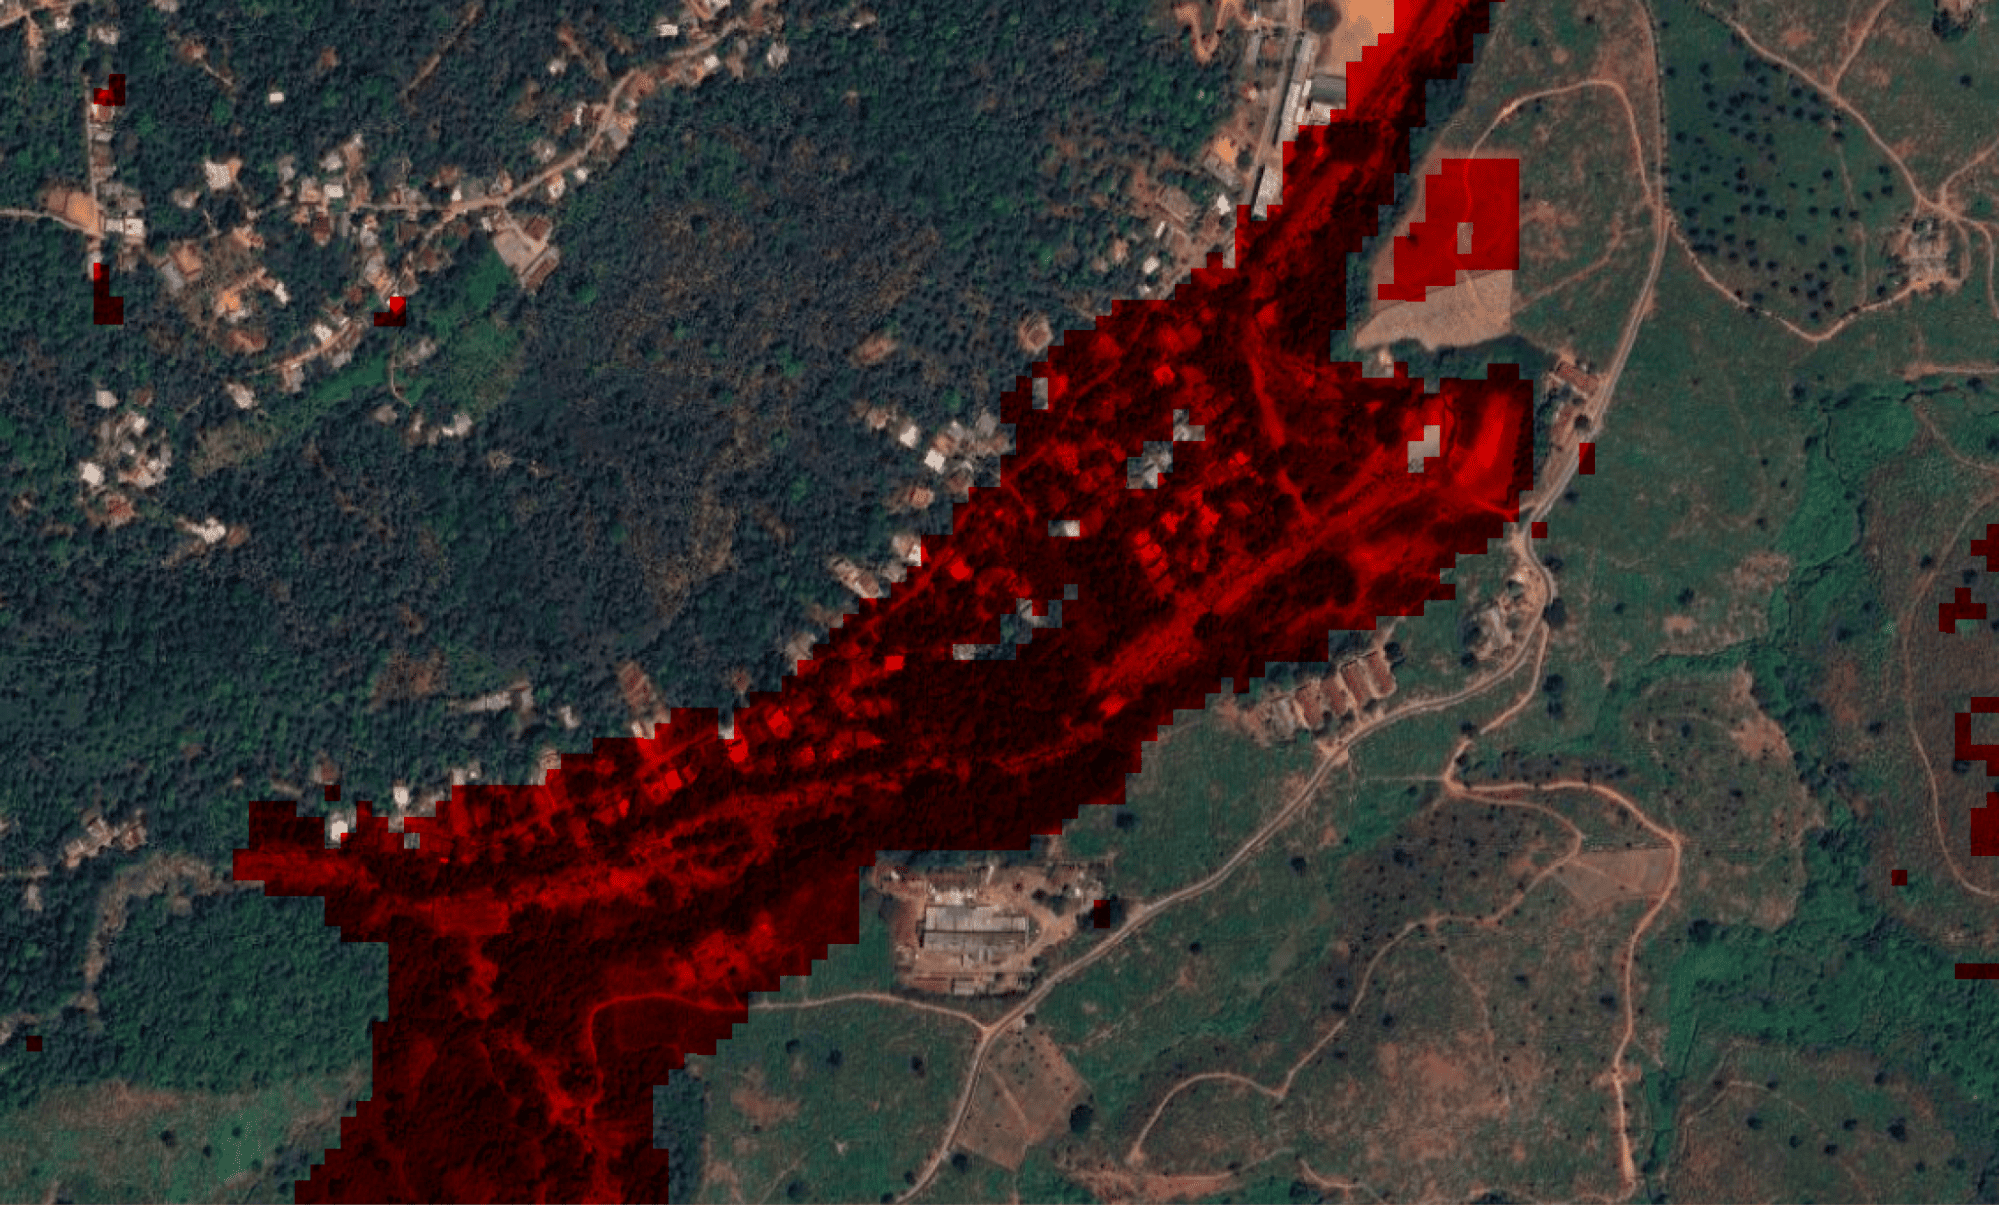
Step 4: Visualize the results
The final map clearly showed the extent of landslide damage within our AOI. Regions where vegetation health had significantly declined due to the landslide were prominently marked in red, enabling a clear visual representation of the affected areas.
Areas with significant vegetation loss
As we can see above, the NDVI differential analysis revealed significant vegetation loss in the landslide-affected area.If we want to quantify the effect of vegetation loss, we can convert the reclassified raster into vector format and calculate the total area impacted by the landslide.
2) NDVI calculation using code (Python SDK)
Rather than using QGIS, it’s also possible to reproduce the above steps in a Python environment leveraging the capabilities of the UP42 Python SDK. We start by importing the necessary packages, and defining a few functions that will help with the workflow.
import up42

import rasterio as rio

import geopandas as gpd

import pandas as pd

import numpy as np

from shapely.geometry import Polygon, Point

from rasterio.windows import from_bounds

from shapely.geometry import shape

from rasterio.warp import transform_geom

import numpy as np

import rasterio

import matplotlib.pyplot as plt

from rasterio.plot import show

import logging

from matplotlib.colors import ListedColormap


#Function to read windows of larger files

def windowed_read(raster_path, subset_polygon):

   with rio.open(raster_path) as src:

       if src.crs.to_string() != 'EPSG:4326':

           reprojected_polygon = transform_geom('EPSG:4326', src.crs, subset_polygon)

           polygon = shape(reprojected_polygon)


       minx, miny, maxx, maxy = polygon.bounds

       window = from_bounds(minx, miny, maxx, maxy, transform=src.transform)


       # Read the data within the window

       windowed_data = src.read(1, window=window)

       window_transform = src.window_transform(window)

       out_meta = src.meta

       out_meta.update({'transform': window_transform})

   return windowed_data, out_meta


#Function to calculate NDVI

def calc_ndvi(band_nir, band_red):

   with np.errstate(divide='ignore', invalid='ignore'):

       ndvi = (band_nir.astype(float) - band_red.astype(float)) / (band_nir + band_red)

   return ndvi


#Function to rescale uint16 data to uint8

def rescale_to_uint8(rgb_array, percentiles):

   rescaled_bands = []

   for i in [0,1,2]:

       data = rgb_array[i]


       pmin, pmax = np.percentile(data, percentiles)


       data = (data - pmin) / (pmax - pmin)


       data[data<0] = 0

       data[data>1] = 1


       data_int8 = (data * 255).astype(np.uint8)

       rescaled_bands.append(data_int8)

   rescaled_rgb = np.stack(rescaled_bands)

   return rescaled_rgb


#Function to properly format Matplotlib colorbar

def add_colorbar(im, width=None, pad=None, **kwargs):


   l, b, w, h = im.axes.get_position().bounds       # get boundaries

   width = width or 0.1 * w                         # get width of the colorbar

   pad = pad or width                               # get pad between im and cbar

   fig = im.axes.figure                             # get figure of image

   cax = fig.add_axes([l + w + pad, b, width, h])   # define cbar Axes

   return fig.colorbar(im, cax=cax, **kwargs)       # draw cbar
From there, we authenticate with the UP42 platform using credentials stored in a JSON file, and define the UP42 Workspace ID as well as the location of the directory to which output files will be saved. Once this has been completed, the Storage class is initialized, and we retrieve assets with the tag “kerala_landslides” using the get_assets() function. In this case, two assets are returned, the pre and post-event images.
CREDENTIALS_PATH = ""#Path to your UP42 credentials as a .json file

WORKSPACE_ID = "" #The workplace ID of the user

OUTDIR = "Outputs" #Path to directory where output files will be stored


up42.authenticate(cfg_file=CREDENTIALS_PATH)


storage = up42.initialize_storage()


search_results = storage.get_assets(workspace_id=WORKSPACE_ID, tags = "kerala_landslides")
Next we define our AOI, a bounding box close to the town of Chooramala in Wayanad.
subset_polygon = Polygon([(76.1363921337466, 11.515849631013172),

(76.13546521738631, 11.471176352767145),

(76.17471969999436, 11.471302945183853),

(76.17464022109388, 11.515385954848254),

(76.1363921337466, 11.515849631013172)])
We then iterate through the results returned by the get_assets() function. For each of these results, we first get the UP42 Asset ID. We then use this Asset ID to initialize an instance of the UP42 Asset class, and use the built-in functions of this class to retrieve metadata information such as the date of the image, and its respective STAC Assets.
From there we generate streaming URLs for four individual bands (each their own STAC Asset), using the get_stac_asset_url() function. Then for each of the bands, we input the streaming url and the AOI polygon into the previously defined windowed_read() function, which returns only the band data contained within the AOI, removing the need to download the entire Sentinel-2 scene.
After this windowed data has been read, the NIR and Red bands are used to calculate NDVI, and the Red/Green/Blue bands are used to create an RGB visualization. Both of these files are then saved locally for each of the search results.
for result in search_results:

   #Get list of STAC assets for each UP42 Asset ID

   asset_id_name = result.asset_id

   asset = up42.initialize_asset(asset_id=asset_id_name)

   date = asset.stac_items[0].properties['datetime'][0:10]

   stac_assets = asset.stac_items[0].get_assets()


   #Get streaming URLs from each STAC asset

   b02_streaming_url = asset.get_stac_asset_url(stac_asset=stac_assets.get("b02.tiff"))

   print(f'Blue band steaming URL: {b02_streaming_url}')

   b03_streaming_url = asset.get_stac_asset_url(stac_asset=stac_assets.get("b03.tiff"))

   print(f'Green band steaming URL: {b03_streaming_url}')

   b04_streaming_url = asset.get_stac_asset_url(stac_asset=stac_assets.get("b04.tiff"))

   print(f'Red band steaming URL: {b04_streaming_url}')

   b08_streaming_url = asset.get_stac_asset_url(stac_asset=stac_assets.get("b08.tiff"))

   print(f'NIR band steaming URL: {b08_streaming_url}')


   #Get B08 (NIR) for the window

   b08_windowed_data, out_meta = windowed_read(b08_streaming_url, aoi_polygon)

   #Get B04 (Red) for the window

   b04_windowed_data, out_meta = windowed_read(b04_streaming_url, aoi_polygon)

   #Get B03 (Green) for the window

   b03_windowed_data, out_meta = windowed_read(b03_streaming_url, aoi_polygon)

   #Get B02 (Blue) for the window

   b02_windowed_data, out_meta = windowed_read(b02_streaming_url, aoi_polygon)


   #Calculate NDVI from the Red and NIR bands

   ndvi_windowed_data = calc_ndvi(b08_windowed_data, b04_windowed_data)


   #Create an RGB raster from the Red, Green and Blue bands

   rgb_windowed_data = np.stack([b04_windowed_data, b03_windowed_data, b02_windowed_data], axis = 0)


   #Define outpaths to save raster

   ndvi_outpath = f"{OUTDIR}/{date}_NDVI.tiff"

   rgb_outpath = f"{OUTDIR}/{date}_RGB.tiff"


   #Save RGB raster

   out_meta.update({"dtype": np.uint16,

                    "count": rgb_windowed_data.shape[0],

                    "height": rgb_windowed_data.shape[1],

                    "width": rgb_windowed_data.shape[2]})

   with rio.open(rgb_outpath, "w", **out_meta) as dst:

       dst.write(rgb_windowed_data)


   #Save NDVI raster

   out_meta.update({"dtype": np.float32,

                   "count": 1,

                    "height": ndvi_windowed_data.shape[0],

                    "width": ndvi_windowed_data.shape[1]})

   with rio.open(ndvi_outpath, "w", **out_meta) as dst:

       dst.write(ndvi_windowed_data, 1)
The next step visualizes the RGB images using Matplotlib so we can have a better idea of what we’re looking at.
fig, (ax1, ax2) = plt.subplots(1,2, figsize=(16,8))

with rio.open("Outputs/2024-03-06_RGB.tiff") as src1:

   rgb_uint16 = src1.read()

   max_value = rgb_uint16.max()

   rgb_uint8_2024_03_06 = rescale_to_uint8(rgb_uint16, [1, 99.5])

   rgb_uint8_2024_03_06 = np.moveaxis(rgb_uint8_2024_03_06, 0, -1)

   ax1.imshow(rgb_uint8_2024_03_06)

   ax1.axis('off')

   ax1.set_title("RGB Image - 2024-03-06", fontdict={'fontsize': 16, 'fontweight': 'bold'})

with rio.open("Outputs/2025-01-05_RGB.tiff") as src2:

   rgb_uint16 = src2.read()

   max_value = rgb_uint16.max()

   rgb_uint8_2025_01_05 = rescale_to_uint8(rgb_uint16, [1, 97])

   rgb_uint8_2025_01_05 = np.moveaxis(rgb_uint8_2025_01_05, 0, -1)

   ax2.imshow(rgb_uint8_2025_01_05)

   ax2.axis('off')

   ax2.set_title("RGB Image - 2025-01-05", fontdict={'fontsize': 16, 'fontweight': 'bold'})


plt.tight_layout()

plt.show()

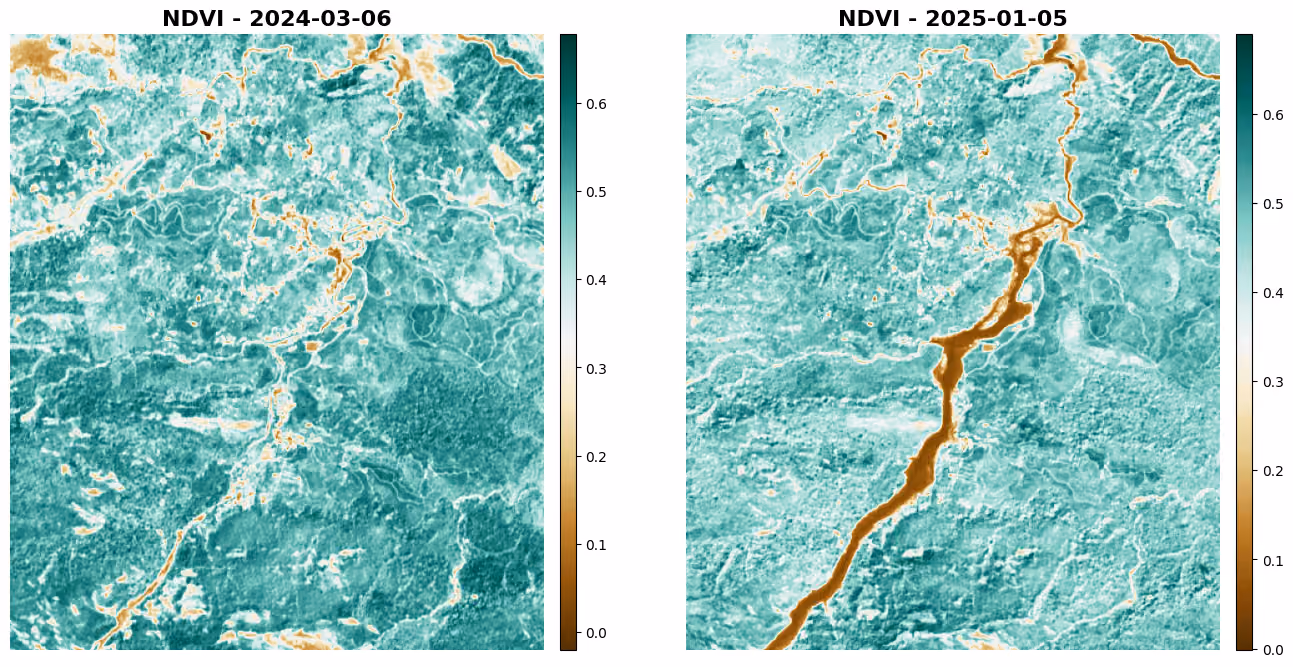
We then do the same for the NDVI rasters, and visualize them as well.
fig, (ax1, ax2) = plt.subplots(1,2, figsize=(16,8))

with rio.open("Outputs/2024-03-06_NDVI.tiff") as src1:

   ndvi_2024_03_06 = src1.read()

   ax1_vis = ax1.imshow(ndvi_2024_03_06[0], cmap = 'BrBG')

   ax1.set_title("NDVI - 2024-03-06", fontdict={'fontsize': 16, 'fontweight': 'bold'})

   ax1.axis('off')

   add_colorbar(ax1_vis, width=0.01)


with rio.open("Outputs/2025-01-05_NDVI.tiff") as src2:

   ndvi_2025_01_05 = src2.read()

   ax2_vis = ax2.imshow(ndvi_2025_01_05[0], cmap = 'BrBG')

   ax2.set_title("NDVI - 2025-01-05", fontdict={'fontsize': 16, 'fontweight': 'bold'})

   ax2.axis('off')

   add_colorbar(ax2_vis, width=0.01)
We then calculate the NDVI differential (ΔNDVI) by subtracting the pre-landslide NDVI array from the post-landslide array. Lastly we then create a mask where ΔNDVI is less than -0.1, indicating a landslide-associated loss of vegetation.
NDVI_diff = np.subtract(ndvi_2025_01_05, ndvi_2024_03_06)

NDVI_diff_thresholded = np.where(NDVI_diff < -0.1, 1, 0)

NDVI_diff_thresholded_masked = np.ma.masked_where(NDVI_diff_thresholded == 0, NDVI_diff_thresholded)
The final outputs can then be visualized, showing the area in red detected to be the most impacted.
fig, (ax1, ax2) = plt.subplots(1,2, figsize=(16,8))


ax1.imshow(NDVI_diff[0], cmap="RdYlGn")

ax1.set_title(r'NDVI Differential ($Δ_{NDVI}$)', fontdict={'fontsize': 16, 'fontweight': 'bold'})

add_colorbar(ax1.imshow(NDVI_diff[0], cmap="RdYlGn"), width=0.01)


ax2.imshow(rgb_uint8_2025_01_05)         # Display raster2 with transparency

cmap = cmap=ListedColormap(["red"])

ax2.imshow(NDVI_diff_thresholded_masked[0], cmap=cmap)   # Only show non-zero values of raster1

ax2.set_title(r"Landslide Area ($Δ_{NDVI}$ < -0.1)", fontdict={'fontsize': 16, 'fontweight': 'bold'})

plt.show()
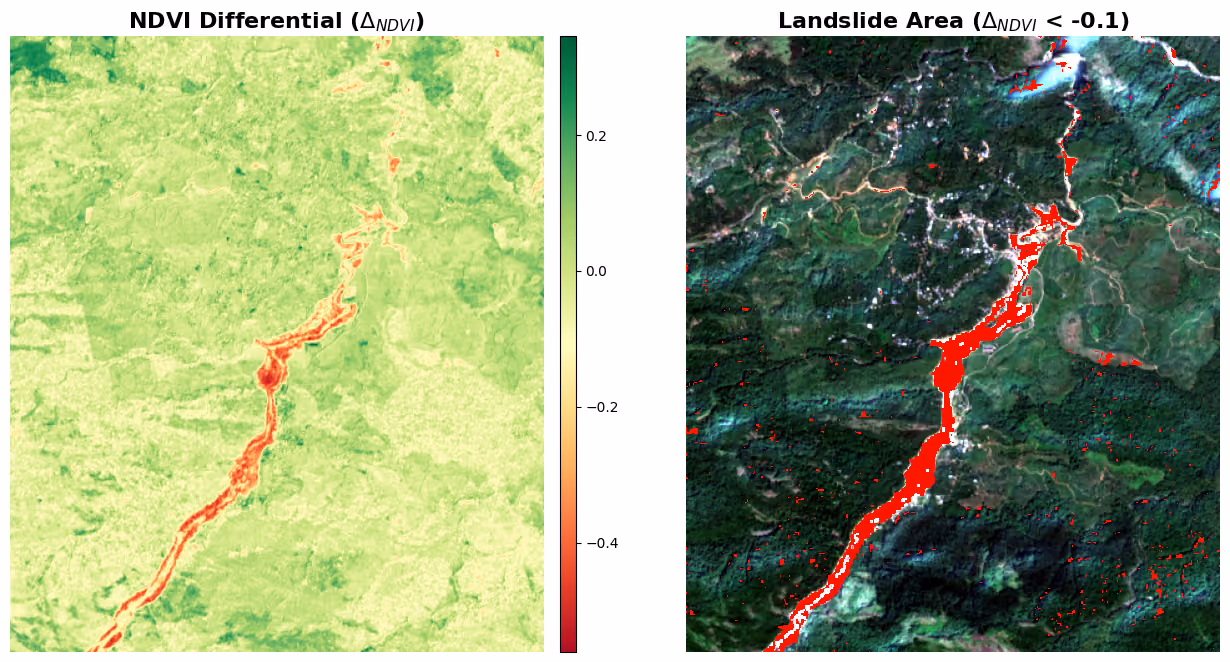
This analysis demonstrates how satellite imagery and tools like QGIS can provide actionable insights into the impact of natural disasters. In this case, it highlights the extent of vegetation loss, which can inform reforestation efforts, ecological restoration plans, and future disaster mitigation strategies.
If you’d like to know more about using UP42 for your needs, you can check out the platform or schedule a demo with one of our geospatial experts.

Subscribe to our newsletter
Stay up to date and learn about our fast-growing new features