By now, the need to transition to a low-carbon economy should be evident to all. As the demand for renewable energy grows, the adoption of solar panel technology will, too. Earth observation (EO) data will be crucial in optimizing solar energy by identifying prime installation locations and enabling efficient monitoring and forecasting of energy production. In this blog, we’ll focus on rooftop solar panels to show how aerial data can improve efficiency throughout the process.
The boom in solar energy
The renewable energy market has grown steadily in recent years, driven by supportive government policies, decreasing costs, rising consumer demand, and technological advancements. In 2024, global electricity generation in the renewable energy sector is expected to reach 8,386.00 billion kWh. And even more growth is expected, with an annual growth rate (CAGR) of 4.22% from 2024 to 2029. Following wind and hydropower, solar energy stands out as one of the most promising options for significantly reducing greenhouse gas emissions.
 Source: Statista Market Insights, link
Several policies are driving this adoption. The EU, for example, introduced the Renewable Energy Directive (RED II) in December 2018, setting a binding target to achieve at least 32% of its energy consumption from renewable sources by 2030. It encourages electrification in different sectors, the creation of support schemes (e.g., green certificates), and makes the installation of small-scale projects easier. It also includes provisions to allow citizens to play an active role by enabling renewable energy communities and self-consumption. In the US, the Investment Tax Credit (ITC) is one of the most important federal policies supporting the growth of solar energy. It allows homeowners and businesses to deduct 30% of the costs from their federal taxes. Since its enactment in 2006, the U.S. solar industry has grown exponentially, by more than 200x.
Identifying solar rooftop potential with aerial data
Aerial images can play a huge part here. When combined with advanced solar panel detection algorithms, they provide detailed data on existing rooftop solar photovoltaic (PV) installations. This data is invaluable for solar power providers, customers, urban planners, policymakers, and grid operators.
But the use cases don’t end here. Aerial imagery also helps assess rooftop potential by evaluating factors such as rooftop size, shading, tilt, orientation, and solar irradiance (the sunlight reaching the rooftop based on location, climate, and season). This helps installers and customers to make informed decisions when considering solar energy solutions. Here are some examples of how you can use aerial imagery.
- Rooftop size: measure the dimensions of rooftops to estimate the available area
- Shading: identify nearby buildings, trees, and infrastructure to assess the best placements and maximize sunlight
- Tilt and orientation: calculate the angle at which solar panels should be installed
- Solar irradiation: assess the amount of sunlight depending on location, climate, and season to predict potential
- Solar panel detection: detecting and segmenting solar panels on different roof types to determine which properties already use solar, and what their current generating capacity is.
Understanding rooftop potential is crucial for estimating electricity generation capacity through photovoltaic panels. It differs from market potential, which focuses on broader market dynamics. There are numerous benefits to using aerial imagery for solar projects. Aerial surveys cover large areas, making them suitable for urban and rural settings alike. The very high resolution of aerial imagery ensures exceptional accuracy and precision in assessing the factors mentioned above. Compared to traditional ground surveys, aerial imagery is quicker, more cost-effective, and especially convenient for homeowners, offering an efficient way to plan and install solar panels. In addition, the data is also incredibly useful for installation companies, helping them identify roofs (and customers) with high value-add from solar.
How can Vexcel and UP42 help?
Vexcel delivers geospatial data products with high accuracy, spatial resolution, and consistency. The Vexcel Data Program is the largest in the world capturing ultra-high-resolution imagery (at 7.5 to 15 cm resolution) and related geospatial data in more than 40 countries, including the U.S., Canada, U.K., Western and Eastern Europe, Australia, New Zealand, and Japan. Vexcel provides very detailed imagery, allowing you to zoom in on all the small details. Get a complete view of your site with Oblique images from all four directions, or stunning clarity with Ortho and True Ortho imagers. Another benefit of using Vexcel is that they can cover large areas in a single image, which makes them ideal for identifying solar panel rooftop potential at scale.
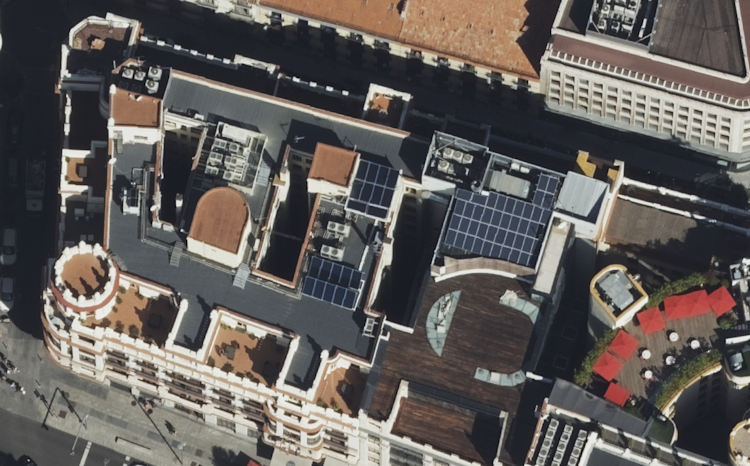
 A Vexcel 7.5 cm ortho image of a city block in Madrid, Spain.
 A Vexcel 7.5 cm ortho image of a city block in Madrid, Spain.
You can purchase Vexcel area data directly through the UP42 catalog. We standardize provider offerings so you can reduce time spent on contracts, integrations, and compliance and maintenance needs. With us, you can place orders and monitor their status, manage, and further process your data in one platform. We also convert aerial and other types of EO data into standard cloud-native asset formats such as COGs and GeoJSON, so you can more easily stream, visualize, and integrate imagery in your GIS of choice.

In this blog, we covered a few examples of how you can use aerial imagery from Vexcel through the UP42 platform. Whatever your needs, our experienced teams will accompany you every step of the way and help you define requirements, recommend the best data, and provide technical support with custom development and integrations. We have the platform and infrastructure to help you meet your project requirements, and we’ll continue to roll out new features.


