Introduction
In the geospatial world, there's a growing interest in using the Red Edge band for precision farming and other agriculture use cases. In a past article, we looked at the role of multispectral imaging satellites in accurately analyzing crop health. The Red Edge band allows our customers to accurately predict and pinpoint subtle stress in crops long before the problem can be detected with traditional vegetation indices, or even with the human eye.
The typical spectral reflectance across the electromagentic spectrum
 Past and Future of Plant Stress Detection: An Overview From Remote Sensing to Positron Emission Tomography. Source: Galieni et al., 2021. https://www.frontiersin.org/articles/10.3389/fpls.2020.609155/full
But often, analyzing vegetation health at scale calls for a sharper level of detail than what most satellites offer. For example, what if you need to analyze the health of individual trees scattered throughout congested urban areas?
With a 30cm native resolution combined with the availability of the Red Edge band, Pléiades Neo is dramatically shifting the way our customers process satellite imagery and derive meaningful insights. This article takes a real-world example to showcase how you can leverage its unique advantages. We’ll order Pléiades Neo data for Buckingham Palace Garden, a dense city park in one of the busiest urban centers in the world. We’ll then use QGIS to further process our AOI, and calculate the Red Edge NDVI to evaluate the health of trees located within the sprawling garden.
Accessing Pléiades Neo Imagery
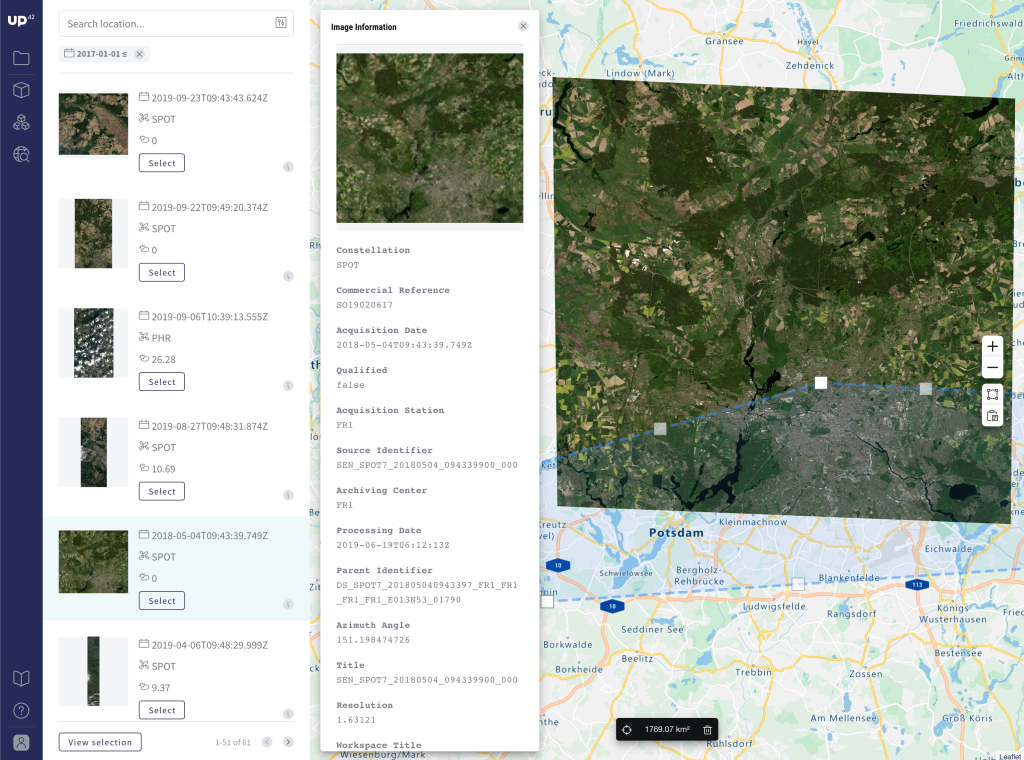
Ordering very high-resolution satellite imagery can be a painstakingly complex process. At UP42, we have consistently strived to simplify the end-to-end process involved in purchasing geospatial data. We offer multiple options through which you can order Pléiades Neo data, as shown below:
-
Option 1: You can order archive imagery or place a tasking request directly though the console.
-
Option 2: Ordering via API - You can place a tasking order by accessing our Tasking API Guide.
-
Option 3: Ordering via email - You can get in touch with our team of geospatial experts directly by contacting us at [email protected].
True to our claim as an API-first platform, we’ve got comprehensive documentation in place to facilitate integration into your existing data pipelines. The Satellite Tasking Guide walks you through the whole process of selecting the specific data set that you need, making an access request, and placing a tasking order with UP42.
 The API calls required to download imagery captured via tasking. Check out the Data Delivery Guide for more information
The satellite tasking process can involve variables that will impact the delivery estimates, like atmospheric conditions and seasonal restrictions. In order to derive the insights you need, it's important to ensure that these variables don’t affect data quality during the tasking process. To account for these parameters, our operations team will conduct a feasibility study of your order to evaluate the level of complexity involved and the chances of successful order delivery for your required AOI. Our internal team of experts will guide you through the whole process. Once the tasking is complete and the images are ready for delivery, they are delivered as assets to storage within the UP42 console.
 Storage folder on the UP42 console
Setting up the Workflow
After placing the tasking order and receiving the order delivery, we are now ready to evaluate the state of vegetation health for our image. We start by loading each of the image files into QGIS. Note that for the Pléiades Neo bundle, separate images are delivered for RGB (red, green, and blue), NED (near-infrared, red edge, and deep-blue), and panchromatic bands. Once you load all the image files and visualize the scene, you can see the exquisite level of detail provided by the 30 cm resolution sensor of Pléiades Neo.
 Pléiades Neo image of Buckingham Palace Garden. Please note that this is a top of the atmosphere image that’s not radiometrically corrected.
We already know the specific AOI that we are interested in analyzing further. As the next step, we clip the image file to an AOI containing the Buckingham Palace Garden to generate a series of raster files. Using the function gdal_merge.py from the GDAL Toolbox in QGIS, we are now ready to merge the NED and RGB raster files. After obtaining the merged raster files, we further pansharpen it on QGIS to prepare for further analysis.
Calculating Red-Edge NDVI
We now have a pansharpened raster file of the Buckingham Palace Garden, and we are ready to calculate vegetation indices using the Red Edge band. Since we are interested in finding out more about the plant quality and growth state, we are choosing Red-Edge NDVI as our preferred index to do this calculation. Using the toolbox available on QGIS, we apply the option gdal_calc.py on our raster file to calculate the output.
NDVIre = (NIR - RedEdge)/(NIR + RedEdge)
In order to visualize the results, we use a gradient scale starting from an NDVI value of zero, thereby allowing us to only focus on the plant cover regions within our AOI. We get an output file that represents a highly crisp representation of Red-Edge NDVI, clearly showing the areas within the garden with the most active vegetation/canopy.
 Red-Edge NDVI results for Buckingham Palace Garden visualized in QGIS
Victoria Memorial is one of the most iconic and recognizable spots near Buckingham Palace Garden. We can zoom in further on the image to identify the phenological states of individual trees and differentiate between various flower beds from the lawn.
 Red-Edge NDVI results for Victoria Memorial
The very high-resolution image allows us to perform further deeper analysis on this image. We can specifically pinpoint really small trees and analyze how their health differs from that of the surrounding shrubs.
 Red-Edge NDVI results for Victoria Memorial
Summary
The combination of a very high-resolution sensor and the new Red Edge band offered by Pléiades Neo opens up a host of new possibilities that go beyond the current status quo. As the above example shows, our customers can now analyze vegetative health and seasonal change in crop health at an individual plant level, allowing them to leverage Pléiades Neo to offer better geospatial solutions for their end customers.


