


Editor's note: this article was originally published on January 15th 2021 by Nikita Marwaha Kraetzig. It was updated on October 12th 2023 by Kevin Enright.
So, you’ve decided to buy and use satellite imagery, but aren’t sure where to start? It's okay. Every single day, satellites capture trillions of pixels of our planet. Sorting through it all can be challenging.
What types of satellite imagery are out there? What are the different kinds of orbits? Where can you find imagery and how do you analyze it? Read on to find out.
This is the definitive guide to satellite imagery: what it is, how to buy it, and the ways in which you can use it.
Earth observation satellites
Before we dive into buying and using satellite data, let’s talk about the basics.
The Earth is a complex system with a huge variety of geophysical processes, many of which are interrelated. Earth-orbiting satellites are among the best ways to understand these from both local and global scales—repetitively and continuously.
Earth is surrounded by satellites, many of which carry sensitive instruments to observe the planet.
These Earth observation (EO) satellites circle our planet in space, collecting information and sending it down to the ground.
Operating alone or as part of a constellation, they provide us with a global perspective from above. They help us monitor and protect our environment, respond to humanitarian emergencies, enable sustainable development, and much more.
There's a wide range of Earth system properties that can be assessed using EO satellites, from vegetation health and ocean salinity to fire intensity and carbon monoxide levels.
Types of satellite imagery
The type of satellite imagery a satellite generates is dependent on the image-capturing method it uses.
Earth observation satellites use remote sensing technologies to monitor and assess changes in Earth’s physical, biological, and chemical compositions.
Remote sensing regards the acquisition of information from a distance. EO satellites can be divided into two main types based on how they capture imagery: passive and active.
Passive and active sensing
Passive (Optical)
Remote sensing systems that measure naturally available energy are called passive sensors.
Passive satellites detect and collect reflected radiation off the Earth’s surface and atmosphere, with sensors designed to detect electromagnetic emissions.
These emissions can be locally produced, such as thermal radiation from vegetation in the infrared spectrum or reflected sunlight in the visible spectrum.
The sun is a handy source of energy for remote sensing. Its energy is either reflected, as it is for visible wavelengths, or absorbed and then re-emitted for thermal infrared wavelengths.
That’s why passive imagery is usually dependent on the day-night cycle.
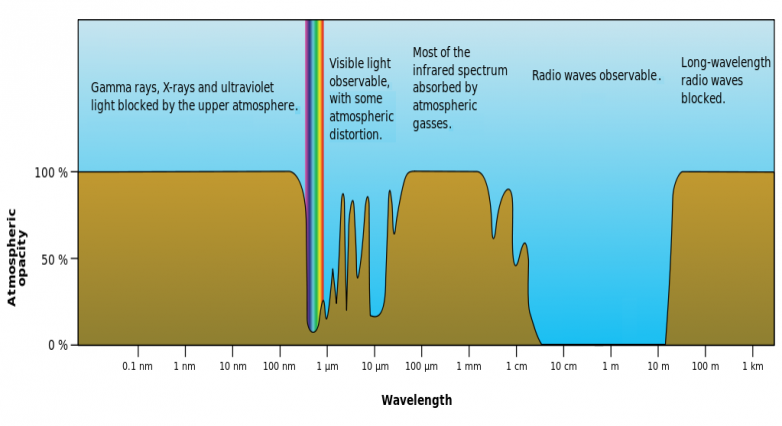 Atmospheric electromagnetic transparency (Source)
Note that, in general, passive satellites are not able to ‘see’ through clouds. Passive sensors cannot penetrate dense cloud cover, so passive EO satellites can be limited when observing areas like the tropics with dense cloud cover.
However, repetitive acquisitions over the same area dramatically increase the chance of acquiring a cloud-free image. Optical EO satellites deliver images that are easy to interpret visually as well as through hundreds of processing algorithms, though they still need to undergo orthorectification, the process of removing distortion.
 Passive sensors collect reflected energy and active sensors provide their own source of energy (Credit: NASA)
Active
On the other hand, active sensors provide their own source of energy for illumination.
The sensor emits a beam of radiation towards Earth and collects the signal that is reflected.
Compared to visible satellite imagery, which relies on sunlight and can only be acquired during daylight hours, active sensors can obtain measurement anytime, regardless of the time of day or season.
Active sensors can be used for studying wavelengths that are not sufficiently provided by the sun, such as microwaves, or to better control how a target is illuminated.
However, active sensors require the generation of more energy, compared to passive sensors such as optical sensors.
Examples of active sensors
Synthetic Aperture Radar (SAR)
Examples of active sensors are synthetic aperture radar (SAR) and lidar. SAR instruments transmit electromagnetic pulses towards the Earth’s surface, where they are then reflected or scattered by the surface features.
SAR antennas can detect and record the returned pulses. The intensity of the returned pulse and the time taken to arrive back at the antenna are used to generate SAR imagery.
Oil spill detection, ship detection, and sea ice monitoring (below) are all applications of SAR satellite imagery taken with an active sensor.
 An example of SAR imagery used to monitor the formation of icebergs (Sources: ESA ENVISAT)
LiDAR
LiDAR (Light Detection And Ranging) uses a laser radar to transmit a light pulse down towards the planet’s surface. A receiver with sensitive detectors then measures the backscattered or reflected light.
The distance to the object (Earth) is determined by recording the time between the transmitted and backscattered pulses. Then, by calculating the distance traveled using the speed of light.
Lidar’s advantage lies in its ability to capture data in a dense field. This accuracy allows Lidar satellite systems to map forest canopies, including tree structure, and the underlying topography.
The technique can penetrate forest canopies and map topography—making it ideal for forestry applications such as tree growth and volume analysis and canopy height measurement.
 A collection of Lidar points mapping trees in Sierra National Forest (Source: California Agriculture)
What is the spatial resolution of satellite imagery?
Spatial resolution is one of the key parameters in satellite imagery and refers to the level of detail that can be retrieved from a scene.
It is the size of one pixel on the ground and can be measured in several ways.
One of the most common is the Ground Sample Distance (GSD), the distance between center points of each pixel. GSD is a measure of how big each pixel is on the ground.
The lower this number, the finer the detail.
Generally, we divide resolution into the following categories:
-VHR (very high resolution): ≤ 50 cm -HR (high resolution): from > 50 cm to ≤ 2 m -MR (medium resolution): from > 2 m to ≤ 20 m -LR (low resolution): > 20 m
For example, Landsat data has a 30 m resolution. This means that each pixel represents a 30 m x 30 m area on the ground. As a result, it is considered a low-resolution image, which can image an entire city without a level of detail that is fine enough to distinguish specific objects such as cars or houses.
When it comes to figuring out what kind of satellite imagery you need, it’s important to understand the differences between various resolutions.
To help you determine which option covers your needs, let’s look at the advantages and disadvantages of low and medium resolution, and how they compare to high and very high-resolution satellite imagery. Or for a deeper dive into this topic, check out our dedicated blog post.
Low and medium resolution satellite data
Advantages:
- A vast wealth of freely available, historical data with global coverage at no charge
Satellite imagery sources such as ESA’s Sentinel data and NASA/USGS Landsat data both provide historical data as far back as 40 years and various spectral bands for you to use in a wide range of applications, from crop monitoring and forestry to regional planning and fire detection.
The Landsat program is the longest-running Earth observation mission to date and allows us to travel back 46 years. Use it to see how Earth was. Whether it’s spotting glaciers before they melted or observing cities before they grew.
- A wide variety of spectral bands for remote sensing analysis
The valuable spectral information contained within each low and medium-resolution satellite image us a significant advantage of using this data. As a result, you can calculate combinations of these bands and spectral indexes, revealing previously unseen information about features or objects.
Use spectral bands in low and medium-resolution imagery to do image pre-processing (pansharpening, atmospheric corrections), and processing (land cover classification, land use).
Having so many spectral analytical opportunities, low and medium resolution, although not high resolution, has significant benefits if you are looking to understand the bigger picture.

 Compare the Landsat 8 natural colour and colour-infrared images above. Less detailed low and medium resolution imagery is ideal to reveal spectral insights.
Disadvantages:
- A low level of detail with only large feature visible
As mentioned above, although low and medium-resolution satellite data has significant advantages, this comes with the tradeoff that is image quality.
If you are looking to spot general features such as bridges, street patterns, or land use, this kind of data is perfect. But, you won’t be able to distinguish individual objects such as cars, houses, or trees.
Use low and medium-resolution imagery to make the most of its spectral value and if you are interested in understanding larger-scale features over time.
High and very high resolution satellite data
Advantages:
- Very high level of detail
The striking advantage of high-resolution satellite imagery is that you can distinguish and identify small objects such as individual cars, houses, or trees. Leading commercial providers such as DigitalGlobe, Planet, and Airbus make extensive archives of the highest resolution commercially available.
With imagery collected over the past two decades, it is possible to find high-resolution imagery for almost any place on Earth.
As new satellites launch with high-performance sensors, a new “very very high resolution” category has been defined for resolutions below 1 m.
For example, the KOMPSAT-3A mission delivers the highest resolution data among all cameras installed on domestic satellites and is capable of acquiring images with a maximum spatial resolution of 50-70 cm.
Such high spatial resolution is ideal for:
- Detailed mapping
- 3D city models
- Precision agriculture
- Forest inventory
- Soil erosion mapping
- Humanitarian aid
- Infrastructure monitoring
- Insurance indexes
- Urban planning
- Encroachment detection
- Maritime monitoring
Below is a 50 cm image from Pléiades. It shows the Bulgarian area of Plovdiv—which was named the 2019 European Capital of Culture.
Because of the image’s very-high resolution, it is possible to zoom in and see individual houses, landmarks, and cars driving in Bulgaria’s oldest city.
 Pléiades is an optical satellite constellation providing very high-resolution products.
 Zoomed in: high-resolution satellite imagery allows us to see extra detail
- Tasking capabilities
With commercial high-resolution satellites, it is possible to pinpoint precisely where and when you are looking to image. Known as satellite tasking, this allows you an agile ability to task satellites to capture the areas of interest (AOIs) you need when you need it most.
Tasking guarantees satellite data availability, which otherwise may be unavailable due to the satellite’s orbit or revisit time. We’ll look at those two satellite characteristics shortly.
Disadvantages
- High resolution has a higher price
One thing to keep in mind when using high and very-high-resolution imagery is that precise details and high-resolution imagery are only possible with higher quality sensors and satellites. So this comes with a larger price tag.
- A smaller area is covered
Usually, the higher the resolution, the less total ground area can be seen in an image. That is good news if you are looking to do small-scale monitoring or analysis.
Because a smaller area is covered, it is important to keep in mind that if you would like to image an area the size of London (1,572 sq km) then you would need four or more images from high-resolution satellites such as Pléiades-1 (400 sq km).
On the other hand, a single Landsat-8 image can capture an area roughly the size of 22 Londons.
Orbits
Satellites are designed on the ground and launched into orbits that are tailored to their purpose.
Here are a few examples:
Low Earth orbit (LEO)
Most Earth observation satellites are in what’s known as a Low Earth Orbit, or LEO. This means that they orbit north to south or south to north as the Earth rotates below them.
In orbit, EO satellites image a swath—a variable width—below the spacecraft using their imaging instruments.
For example, below is an image of NASA’s Terra satellite, carrying the MODIS instrument and others as it orbits the planet. It is imaging with a swath of 2,330km, allowing it to cover almost the entire world every day—as it orbits the Earth and the Earth orbits below it.
This wide viewing swath means that Terra sees every point on our planet every 1-2 days in 36 spectral bands.

Looking for higher spatial resolution? You’ll need a satellite with a narrower swath width and a longer time between imaging instances.
Geostationary
Much further away from the Earth, geostationary satellites are in orbit around the Earth and sit just above the equator.
These orbits are generally used for telecom and weather satellites and not for EO satellites.
But, geostationary orbits are worth knowing about when looking at the kinds of orbits satellites travel in and if you are interested in weather data to complement your data investigations.
Geostationary orbits are positioned 36,000km away from the Earth, which is just far enough, so it rotates at the same angular rotational rate as the Earth itself.
This orbit was given the name geostationary because satellites appear to be stationary compared to the Earth itself.
Weather forecasting and climate monitoring satellite, Meteosat-9 for example, appears to hang directly over Africa. As a result, it is able to image Africa every 15 minutes and deliver detailed full disc imagery for nowcasting—the process of detecting rapidly developing high impact weather and predicting its evolution to safeguard lives and property.

The disadvantage of geostationary orbits is that because of their nature, you cannot image the entire planet with one geostationary satellite.
To tackle this, geostationary satellites are positioned in a ring around the Earth with multiple satellites to paint a global picture. That’s why the Meteosat satellites—Meteosat-8, 09, -10, and -11 operate over Europe, Arica, and the Indian Ocean—delivering rapid weather forecast data every 5-15 minutes.
With any satellite in orbit, satellite’s velocity is governed by the balance between the centripetal force—which keeps objects moving along a curved path—and the gravitational force.
So, in the case of geostationary satellites, by positioning them 36,000km away from the Earth, the satellite’s velocity means that it takes one day to go around its orbit. This is the same time that the orbit takes to make one revolution on its axis—and so geostationary satellites appear to hang in the same position above the Earth continuously.
Sun-synchronous orbit (SSO)
Low Earth-orbiting satellites are usually placed in what is called a sun-synchronous orbit, or SSO.
This means that they pass over the Earth at the same local time each day—allowing easy comparison between images taken on different dates.
If illumination conditions were to change drastically, it would be difficult to tell whether changes in the imagery received are due to changes on the Earth’s surface or due to illumination conditions.
So, using a sun-synchronous orbit, we can identify changes in the Earth’s environment much more easily.
Satellites in SSO are useful for weather satellites as well as imaging due to their consistent lighting. To monitor changes across many days, weeks, months, or even years, comparing imagery at around the same time every day is crucial to uncovering changes.
That’s why scientists use SSO satellites to predict storms, monitor forest fires, or accumulate data on long-term challenges such as rising sea levels or deforestation.
SSO is a particular kind of polar orbit. This means that they usually travel past Earth from north to south, rather than from west to Earth, and pass roughly over Earth’s poles.
Coverage
Satellites can allow for truly global coverage even above the most remote locations. Coverage essentially refers to the amount of land that a satellite can image.
Swath width
Mentioined earlier, the width of the area viewed by the satellite is referred to as the *swath width*.
As a satellite orbits the Earth, the sensor “sees” a particular portion of the surface. This area is referred to as the swath.
Imaging swaths vary between tens and hundreds of kilometers wide.
Since the Earth rotates (from west to east) beneath satellites, the swath can cover a new area with each consecutive pass because of this movement.
In this way, the satellite’s orbit and the Earth’s rotation work together to allow complete coverage of the Earth’s surface once a satellite has completed one cycle of orbits.
Satellites with different swath widths have different temporal resolution—this is the time between observations of the same point on Earth, or revisit rate.
Let’s look at the revisit rate next.
Revisit rate
As well as covering the globe, satellites enable regular repeat observations. A satellite’s revisit rate, or revisit period, is the time elapsed between observations of the same point on Earth by a satellite.
Revisit rate depends on a satellite’s orbit, target location, and the swath width of the sensor.
Typically, large-swath satellites can revisit the same location more often. Most EO satellites are in the aforementioned low Earth polar orbit named SSO. This kind of orbit typically has an altitude of around 700 km and an inclination of 98˚—the orbit’s angle in relation to Earth’s equator.
Due to this high inclination, a satellite’s revisit time is longer for equatorial areas than for polar regions.
How do we define the revisit rate?
When it comes to defining the revisit rate or time, it entirely depends on the point of view.
For a satellite, its revisit time is the elapsed time before it traces its path over the exact point on the Earth’s surface again. From the point of view of an EO user looking to use satellite data (such as yourself), then revisit time is the length of time we need to wait for the satellite system to observe the same point on Earth.
We differentiate between these two points of views and definitions because of the “agility” feature that most EO satellites have. This is its ability to modify its *attitude* (its orientation in space), to observe scenes outside its ground track or ground trace—the path directly beneath the satellite.
Therefore, the ground trace is the projection of the satellite’s orbit onto Earth’s surface.
With revisit rate, it’s important to keep cloud cover in mind. Too many clouds can mean that you may encounter data gaps when looking for imagery. This is since most providers of commercial data only sell imagery with less than 20% cloud cover.
 Ground track of the International Space Station for approximately two periods. The light and dark regions represent the regions of Earth in daylight and at night.
 Various acquisition strategies using the agility of an EO satellite. (Source)
How can we reduce the revisit rate?
In some cases, a short revisit rate or time makes all the difference. EO constellations can be used to reduce the time needed to wait for imagery acquisition over your chosen area.
By augmenting the number of satellites in orbit, we can lower the waiting time between observations of the same scene. An excellent example of that is the two Pléiades constellation satellites.
Orbiting on an SSO, they can acquire images in a +/- 30˚ corridor around their ground trace. This means that while the periodic cycle of their orbits is 26 days, the satellites’ agility and the phased orbit of the Pléiades constellation offer a two day revisit for any point on Earth.
Using steerable sensors, a satellite-borne instrument can view an area before and after the satellite’s orbit passes over—resulting in a revisit time that is less than the orbit cycle time. This is known as satellite tasking. Steering satellites can also increase the incidence angle—the angle from the target point of view. It represents the angle between the ground normal and look direction from the satellite.
 The incidence angle is the angle from the target point of view. (Source: Airbus Defence and Space)
Why is the revisit rate important?
The revisit rate is a key consideration for several monitoring applications, especially when frequent imaging is required to monitor environmental disasters such as the extent of flooding or the spread of an oil spill.
Especially when events are unfolding on Earth, whether it be disaster relief, business intelligence, or energy-related, the revisit rate plays a crucial role in acquiring the images that are needed when they are needed.
Rapid revisit refers to the ability to make repeated image captures with short time intervals. Satellite constellations such as Blacksky can take multiple images per day of the same location anywhere on Earth.
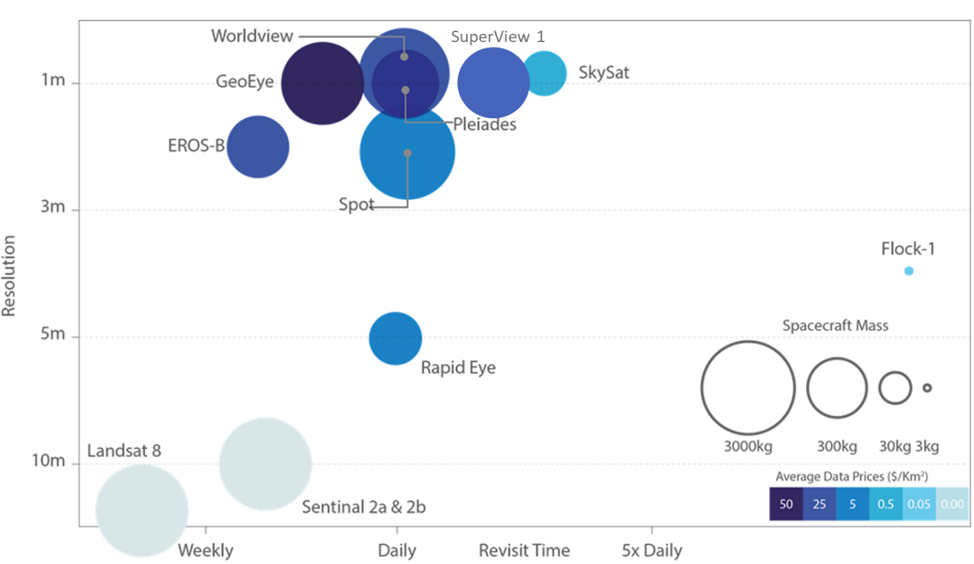 Spatial resolution vs revisit time for various satellites (Source: Satellite Applications Catapult 2017, adapted from EO21 Project)
Tasking a satellite
As mentioned earlier, satellite tasking provides you with the agile ability to task satellites to capture the areas of interest (AOIs) you need when you need it most.
This means that you can request and collect imagery on-demand in the case of time-sensitive projects that require close to real-time insights. As aforementioned, tasking means that you are guaranteed a specific area is captured during a particular date range and with any other preferred specifications you may have (within reason).
UP42 tasking is available for you to commission a wide range of constellations, from optical sources like Pléiades Neo and radar sources like Umbra and ICEYE, easily—with priority tasking for urgent requests.
Requesting and collecting tasked imagery allows you to monitor recent changes across geographically distributed areas—revealing reliable insight for challenges such as disaster monitoring, maritime surveillance, and encroachment detection. Find out more in our dedicated tasking blog post.
Historical satellite imagery
For some use cases, such as land-use change analysis, you may want to look back several years in time for archive satellite imagery of a given area.
Something to consider: EO instruments of the past were not nearly to the standards we see in today’s satellites.
So, the further back in time you look, the lower the quality of the images may be.
Still, there many great satellites in operation today that are great candidates for looking into the past, as shown in the figure below. We've also got a dedicated archive imagery blog post, if you'd like to find out more.
 Known as archive satellite imagery, historic data can help to fill in the gaps when exploring developments over time such as land use, deforestation, and ice cover. (Source)
How does satellite imagery pricing work?
There are two types to consider when budgeting for satellite data: free or commercial data sources.
As shown in the chart below, there tends to be an inverse relationship between the spatial resolution of imagery and the cost.
Let’s look at both free and commercial satellite imagery:
 A chart depicting the relationship between spatial resolution and price of mainly commercial satellite imagery, with a couple examples of free data sources (e.g, Sentinel-2, Landsat 7/8). Prices were taken as averages from several resellers and do not account for discount pricing or marketplaces like UP42 with more flexible pricing options. Minimum area price is calculated from taking the minimum area size and multiplying by the price per sq km for a given data source.Source
Pricing depends on the data source
Free data sources
There are many types of free data sources available, primarily from governments or research institutions, but also distributed on many commercial platforms.
These data sources often come at lower resolutions and cannot be tasked.
However, free data sources offer significant advantages like more regular revisits, increasing the number of observations made of the same point on Earth.
Additionally, because of their broader availability and use, occasionally free data sources have more research-backed applications. On UP42, we offer open data from ESA's SENTINEL-2. This collection contains archive optical imagery from 2017 onwards, in up to 10 m resolution.
Some other free data sources include USGS/NASA's Landsat series, and NASA's MODIS.
These data sets are generally distributed as full scenes, meaning the entire swath or footprint is downloaded.
They also generally come at Level-1 processing, essentially, top-of-atmosphere (TOA) level, meaning effectively that atmospheric corrections must still be performed.
Commercial data sources
Commercial datasets are available from various providers and distributed from an even wider range of resellers at a range of prices.
Thus, it isn’t easy to generalize pricing formats since every provider will have their own guidelines.
No two providers are the same. But, most have a minimum AOI size that must be purchased, with options of various levels of pre-processing, some that are only performed for an additional fee.
When buying satellite imagery, you may pay per tile or square kilometer. Volume discounts are common, and prices can vary according to the following factors:
- Cloud coverage and incidence angle (only applies for tasking)
- "Freshness" or recency of acquisition (for archive data)
- Archive vs. Tasking
- Delivery time
- Subscription service vs. pay-per-use
- Pre-processing
- Bands (e.g panchromatic vs. full multispectral)
With commercial satellites, images can either be from archives or, if you are looking for up-to-date imagery, can be tasked on demand.
It’s important to note: Tasked data is more expensive than archive and usually requires a larger minimum area size.
However, it comes with the guarantee of the requested specific date range and any other preferred specifications (within reason).
Moreover, many distributors or resellers apply "pricing uplifts" which is essentially an additional fee if you want to share your data with more than 3 to 5 users.
 A chart of various high-resolution and medium-resolution satellite imagery sources and their respective order prices (per sq km, not accounting for minimum area size) based on whether the order is for archive imagery (> 90 days old), standard tasked imagery, or priority tasked imagery. Some companies also offer options of fresh archive (< 90 days) and rushed tasking.
Over the past two decades, commercially available satellite imagery has evolved into a mature and thriving industry.
Rich, crisp imagery that is global and cloud-free was once reserved for government intelligence eyes only. Now, commercial satellite imagery is a treasure trove of valuable information for anyone looking to purchase and use it.
So, how can you do that? Let's find out.
How to access satellite imagery
With trillions of pixels of our planet being captured from space every day, there’s never been so much data within reach. You can find free EO data in lots of places, including on UP42. But when you need commercial satellite imagery, purchasing and using satellite imagery can become a little more complicated. Historically, it's often been a tedious and time-consuming process.
Before, it would involve:
-
Identifying what kind of data you need, depending on what you’re investigating—for example, archive visible imagery at around 1m resolution to assess land cover change.
-
Determining your ideal AOI(s) and date range, e.g,. North Africa in the summer of 2017 and summer of 2019.
-
Scouring the internet for which providers have that data, at that resolution, for your AOI(s) and time frame(s).
-
Finding a suitable provider or reseller and contacting them directly, sometimes viewing a catalog of data, but more often not.
-
Making a formal request for a specific data set.
-
Waiting for providers or resellers get back to you with a price quote and a contract for you to sign.
-
Confirming the data you want to purchase and waiting for data delivery electronically via File Transfer Protocol within the week, or pay extra fees for a rush delivery (even for archive data).
There's been a lot of conversation surrounding the struggles of buying satellite imagery—especially if you're not a large corporation or have a smaller AOI or budget.
Akin to finding a needle in a haystack, navigating the infrastructure set up by some providers, and finding affordable data that you can work with, is an industry problem that many are trying to solve.
At UP42, we advocate for and work towards making it easier for people to access, analyze, and afford and utilize all kinds of geospatial data.
Marketplace models such as UP42’s bring the data providers to you, giving you direct access to extensive Earth observation datasets.
By democratizing access to EO information, you can skip most of the steps above and purchase and download just the data needed to coveryour AOI—or even access streamng data for easy integration with web-apps.
The UP42 marketplace offers satellite imagery from Pléiades Neo, SPOT, Landsat-8, TerraSar-X, Sentinel-2, and many, many more.
You can browse other types of geospatial data such as HxGN and Getmapping aerial data, Intermap DEMs, exactEarth AIS data, and Meteomatics weather and ocean data.
For example, to make high-resolution imagery more accessible and budget-friendly, the UP42 marketplace allows you to browse a variety of different data options, explore coverage through the catalog, as well as estimate costs before even purchasing imagery and running jobs.
This way, you only buy and pay for your chosen AOI.

Additionally, if you’re using the UP42 Python SDK, the Quicklooks feature allows you to see a preview of all the quicklooks for images that cover your AOI. This can then be used within Jupyter Notebook to create an interactive map.
One more thing: A lack of standardization in the geospatial industry often leads to low availability of plug-and-play integrations. If you want to build a robust backend and easily explore data from different providers, STAC (a standard for geospatial data) can give you the foundation.
We recently introduced a cloud native asset model. Regardless of provider or file type, data on UP42 is standardized, structued, and easy to sort through. You don't need to download a gigantic file and sort through it to find the one scene you need: you can stream the part of the file that you need within the platform. Check out our blog post on CNAM for more information.

Analyzing satellite imagery
Now that we’ve seen what kinds of satellite data exist and how you can find it—where next?
Processing algorithms
Satellite imagery provides essential insights, allowing you to detect changes, spot trends, find patterns, identify objects and derive vegetative indices.
To extract those insights, you will need to apply machine-learning algorithms or processing modules, such as quality enhancement.
Here are some examples of common algorithms.
- Pre-processing
These enhance image quality, convert input data, or clip raster images into tiles to create Analysis Ready Data (ARD) to feed your algorithms.
- Indices, bandmath, and statistics
These types of algorithms can do things like help to analyze crop health with an Enhanced Vegetation Index (EVI) or a Normalized Difference Vegetation Index (NDVI), or to map the impact of environmental changes, such as flooding or burnt areas, in your area of interest.
Other processing types
These range from object identification, area classification, and change detection to vertical-specific algorithms.
Computing power
When analyzing data, computing power is vital. However, crunching terabytes of imagery on a planet-wide scale is no easy feat. You’ll need significant processing capabilities and computing power.
It’s said that it would require eight million people doing nothing but looking at satellite imagery 24/7 to ensure every image taken each day is looked at, let alone analyzed.
That’s where the machine learning tools mentioned previously, as well as infrastructure, come in.
UP42 gives you direct access to the EO datasets you need and makes it easy to integrate them into your own workflows.
Leveraging the power of cloud computing, UP42 can scale up or down, parallelizing where necessary. The UP42 API provides flexibility and scalability, while the UP42 Python SDK and developer tools enable you to move from testing to production sooner.
The most fascinating part of the coming decade is the synergetic capacity of all the EO satellite missions in space. How can we use all these different types of information and make the most out of this wide range of complementary data?
Cutting-edge analytics are continuously being developed to offer new insights into the Earth as an interconnected system. This enables us to explore EO data synergistically to study the Earth’s systems.
Using satellite imagery
Now that we’ve looked at what satellite imagery entails and where you can find and analyze it, how can you make use of it?
Satellite images have become a priceless repository of geospatial data that drive solutions in a wide variety of fields—spanning across industries and creating significant societal, environmental, and economic impacts.
Climate change
Global surface temperatures are increasing, global sea levels are rising, ice is melting, and changes in the pattern of precipitation are bringing intense rainfall and floods to some areas and devastating droughts to others.
Satellite measurements are essential to improving our understanding of climate change and formulating effective strategies. As our world warms, knowing information such as surface warming trends and heat flux areas is more important now than ever.
Read 'Taking Earth’s Temperature: Land Surface Temperature Monitoring (LST) Explained'
Use satellite imagery to inform decision making, fill the data gap, create climate action, and predict the future.

Deforestation
The economic, social, and environmental impacts of deforestation can be drastic. Often the result of poor land management and illegal logging, deforestation ends in loss of critical habitat for wildlife, loss in government revenues, and distortion of global markets.
Remote forests are difficult to monitor. Satellite monitoring enables the true extent of deforestation to be understood. Use UP42 to combine satellite data and off-the-shelf analytics to detect indicators linked to deforestation such as the presence of trucks or increase in settlements.
Precision agriculture
Agriculture consists of complex interdependent processes. In order to maximize yield and sustainability, resources should be organized efficiently. In contrast to conventional agricultural methods, the use of digital satellite data can increase resource and cost efficiency drastically.
Optical imagery can provide invaluable insights into crop growth and development. In other cases with high cloud cover, radar monitoring can be used.
Use satellite imagery to build intelligent solutions to increase crop yields, effectively manage field use, and save resources in an industrial farming environment.
Satellite imagery coupled with agriculture-specific algorithms enable targeted application of fertilizers, pesticides, and irrigation—advancing agriculture both economically and ecologically.
Read 5 Things to Know About NDVI (Normalized Difference Vegetation Index) or learn about how satellite imagery can detect stress before the human eye in plants.

Insurance
When disaster strikes and losses occur, there’s nothing more important to insurance policyholders than recovery.
In the key moments between disaster and disaster relief, customers rely on their insurers to respond as quickly and efficiently as possible. For remote locations especially, assessing claims and fraud can be cumbersome and costly.
Use the latest satellite information and high-speed, scalable cloud-computing, so you can do:
- Site identification
- Fraud verification
- Claim assistance
Satellite insights allow you to expedite and automate insurance claim verification and fraud identification for homes, crops, and other assets. You can read more about how our customer, AI Superior, helped develop an insurance solution through satellite imagery in this case study.
Encroachment
Encroachment ranges from the violation of tenure rights in protected public or private lands to settlement growth near powerlines, railways, roads and other critical infrastructure.
In all these cases, encroachment can increase hazard vulnerability, worsen socio-economic disparity, and lead to conflict and environmental degradation.
Satellite imagery enables encroachment to be detected and insights to be gathered on the rate of development, size of encroachment, and projected costs and risks.
Explore near real time Earth observation data, processing algorithms, and powerful infrastructure to detect and mitigate encroachment for all of your AOIs.
Humanitarian crises
Thousands of people across the globe are forced to flee their homes everyday due to disasters and conflict. Accurate, relevant, and timely data is crucial to humanitarian crisis management.
Under-estimating the number of displaced people can mean delayed response and prolonged suffering—while overestimation can lead to unnecessary costs and discrediation.
Gain access to evidence-based knowledge to support disaster risk reduction and response plans with satellite imagery and analysis data. With satellite insights, you can get the right answer at the right time.
This allows you to t__rack humanitarian crises as they unfold__ around the world and respond with timely and targeted aid.
Maritime
The ocean covers 70% of the Earth’s surface. As a result, maritime activity tracking can require analysis covering thousands or even millions of square kilometers.
Having a satellite’s-eye-view optimizes your maritime activity—combined with additional data streams such as AIS and weather parameters.
Satellite imagery enables you to track, predict, and optimize maritime activity on a global scale.
Integrate an array of data types and build maritime products to monitor and improve vessel, port, and open water activity.
This way, you are able to automatically detect changes and prevent asset loss by enhancing your situational awareness.
Read A Complete Guide to Marine Traffic Tracking Technologies and AIS Data for more information.

Summary
This guide aimed to provide you with a starting point in the decision process for selecting your appropriate EO solution.
EO is defined as the process of making observations of the Earth’s surface and atmosphere using remote sensing instruments.
Our planet’s surface can be observed using various methods, producing different digital imagery types, each with its advantages and disadvantages.
Both free and commercial satellite imagery sources are available for you to browse and determine your preferred choice of imagery.
Next, buying and then analyzing satellite imagery has historically been complicated, but new ways such as UP42’s marketplace model simplify and aggregate both data and processing products in a single place.
There are myriad ways in which you can use EO imagery. From monitoring deforestation and observing crop health to detecting encroachment and doing maritime surveillance—you can discover insights tailored to your needs.
Ready to access and analyze satellite imagery, AIS data, weather parameters, and more? Sign up to UP42 and build geospatial solutions today.


