Red Edge detects vegetative stress earlier in plant growth cycle

The availability of Red Edge band data from multispectral imaging satellites now accessible on the UP42 marketplace gives agricultural customers the ability to pinpoint subtle stress in crops before the condition is detectable with traditional vegetation indices or the naked eye. This information enables farmers to assess the root cause of the problem and take remedial action before the ailment spreads or plants are lost.
UP42 customers can take advantage of Red Edge data captured by the two new Airbus Pleiades Neo satellites (available on UP42 as of November 2021) and 10 HEAD Aerospace satellites. The volume and frequency of Red Edge data collection will increase further in 2021 and 2022 with the planned launches of additional satellites by both organizations.
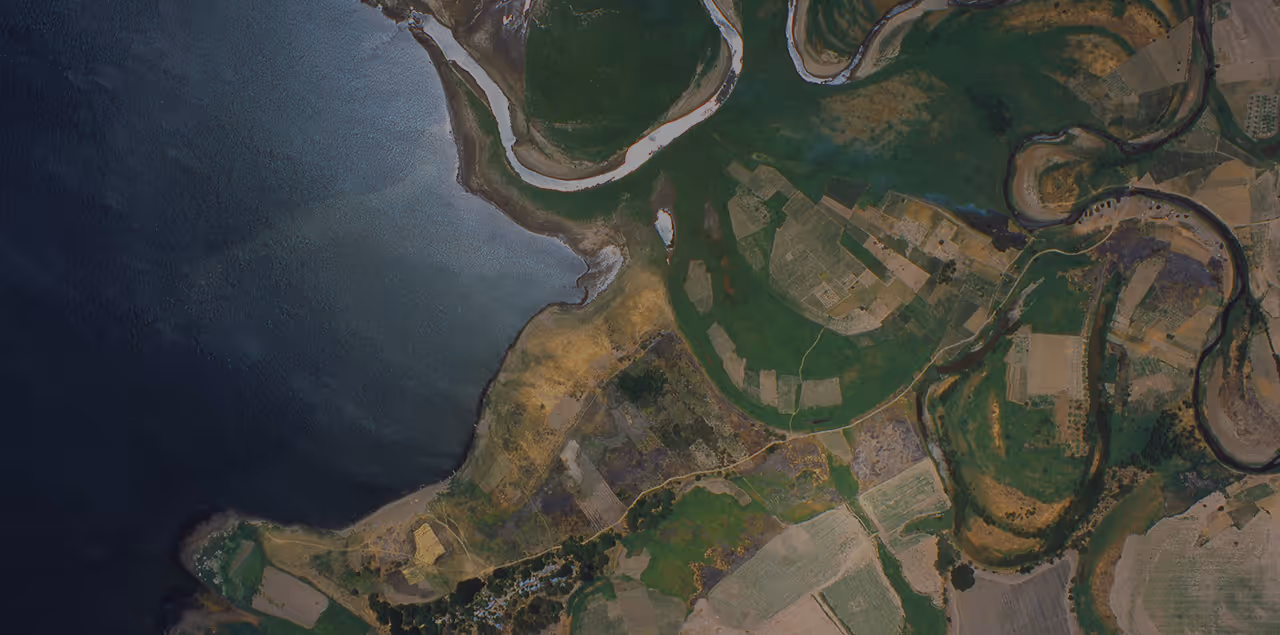
The most common causes of plant stress are poor irrigation, inadequate nitrogen fertilization, disease, and pest infestation. Any of these problems can result in lower chlorophyll production in green plants. Multispectral imagery has been relied upon for decades to identify these crop health issues, primarily by combining Visible Red and Near Infrared band data in formulas referred to as vegetation indices. In addition to revealing plant stress indicated by chlorophyll content changes, these indices are used to estimate biomass and canopy density.
Governmental organizations have long relied on coarse-resolution Landsat data to assess vegetative health and predict harvests in large regions as a crucial aspect of ensuring food security. More recently with the advent of higher-resolution data sets, farmers began calculating indices on a more granular level to assess crop conditions and implement precision farming practices in individual fields.
The addition of Red Edge data considerably enhances these vegetation indices and their applications by enabling users to detect anomalous crop health earlier in the growth cycle. For even a small farmer, this means more time to diagnose the problem, apply a remedy, and save the harvest. At the regional and national level, this can give government agencies advance notice of an impending crop failure that could have widespread societal consequences.
The Red Edge Difference
On the electromagnetic spectrum, the Red Edge band roughly spans 670-760 nanometers, placing it between the Visible Red and Near Infrared bands.
"Red Edge is the region of the spectrum where spectral reflectance of green vegetation changes rapidly," said Alexandre Wiefels, Technical Manager at HEAD Aerospace in France. "Vegetative stress will show itself here first."
This is explained by the strong absorption of energy in the Red Edge wavelength by chlorophyll in green vegetation. A healthy plant has more chlorophyll and absorbs more light energy in the 670-760 nm sliver of the spectrum. Higher absorption means less reflectance -- and lower spectral value -- in this wavelength. This means stressed vegetation has stronger reflectance than healthy plants of the same species in the Red Edge.
The spectral 'signature' in the Red Edge is an excellent indicator of vegetative health. Agronomists, botanists, and other scientists who have traditionally assessed plant vigor and biomass density with three common vegetative indices are replacing visible Red Band values with Red Edge reflectance numbers in the formulas. Enhanced with the Red Edge, the three most widely used vegetation indices—Normalized Difference Vegetation Index (NDVI), Modified Simple Ratio index (MSR), and Green Chlorophyll (CIgreen)—are now detecting changes in chlorophyll and nitrogen content earlier than was previously possible.
"Inclusion of the Red Edge in these indices improves both the accuracy of crop condition classification and differentiation of plant species," said Wiefels.
A spectrum of applications
From a single interface offering satellite data from the Airbus Pleiades Neo and HEAD Aerospace constellations noted above, the UP42 platform enables users in agriculture and other sectors to query these satellite imaging platforms and obtain the Red Edge data set with the spatial detail and geographic coverage to meet specific applications. From the satellites mentioned above, Red Band data is now available at resolutions ranging from 30 cm to 20 meters—sufficient to monitor individual fields or expansive growing regions.
For example, stress in a single fruit tree and possibly some individual row crops can be identified with very high-resolution data from the Airbus Pleiades Neo and HEAD GaoFen Multi-Mode (GFMM) satellites. Assessment of issues affecting entire farm fields or even large geographic regions can be performed with moderate- and coarse-resolution imagery captured over wide swaths of land by the HEAD NightVision (19km), NatureEye (830km swath), and HyperScan (110km swath) constellations.
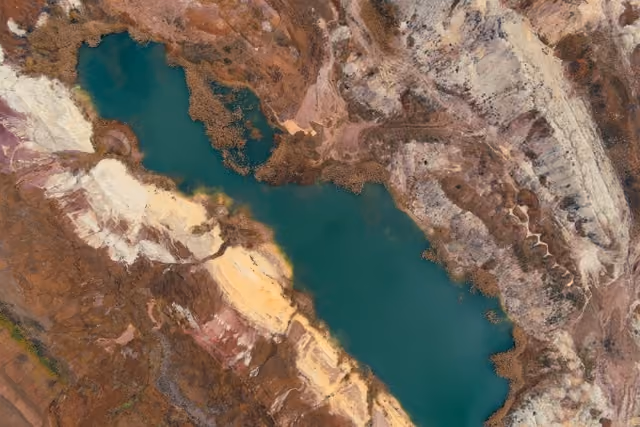
Just as importantly, the applications of Red Edge data are not limited to agriculture, Wiefels explained. Foresters, for example, can use the data in similar ways as farmers -- to spot disease or infestation in tree stands. And environmentalists are experimenting with the data to study water quality in lakes and streams using the presence of chlorophyll-bearing phytoplankton as a gauge of health in aquatic ecosystems.
Whatever your field of application, you can try very high resolution data with the Red Edge by ordering Pléiades Neo directly on UP42.

Subscribe to our newsletter
Stay up to date and learn about our fast-growing new features