


The geospatial industry uses some intimidating terms. From multispectral to normalized digital surface models, it may seem unintuitive at first.
But don't let that deter you. Satellite tech has quickly become one of humanity's biggest assets. The purpose of this article is to explain terminology around optical satellite imagery and showcase its capabilities. And, obviously, to help you access it via the UP42 platform.
As of August 2025, we've got a ton of the world's best optical satellite data providers: Airbus, BlackSky, Geosat, IMPRO, ISI, Maxar, Planet, Satellogic, SIIS, and 21AT, just to name a few.
Editor's note: this article was originally published in September 2022. It was revised and updated in August 2025.
What is optical satellite imagery?
In some of our previous articles, we've divided satellite capabilities into active and passive sensors. Active sensors collect data by emitting their own sources of radiation, and collecting the signals that return, while passive sensors collect data from existing sources.
The vast majority of optical satellites are passive. They take imagery in the visible or near-visible portion of the electromagnetic spectrum, using the sun's radiation as it reflects off of our planet and atmosphere. Radar satellites, on the other hand, are active, as they emit their own microwaves or radio waves, and usually require much more processing to get an image that makes sense to the human eye.
Optical satellites have one major advantage over radar satellites in that they require much less energy, making them cheaper to use. On the other hand, they depend on the sun's light, so they usually can't collect much information at night. They also work best with minimal cloud cover, or else multiple passes will be needed to image an area of interest.
The spatial resolution of an optical satellite is an important factor: it describes how detailed a satellite's imagery can get. Spatial resolution is measured by pixel capability, which refers to the smallest possible ground area that can be displayed in an image: for example, a 10m/pixel satellite can capture an area of 10 by 10 meters in each pixel, which means that all objects with that area will be displayed in one pixel. The lower the number, the more you'll be able to see. Pléiades Neo, for example, has a very high resolution of 0.3m/pixel, and so can distinguish individual objects like trees and bushes.
Another great thing about optical satellites: while they operate mostly on the visual portion of the electromagnetic spectrum, they can also capture wavelengths that are invisible to the human eye. The types of electromagnetic radiation that a satellite can capture are divided into spectral bands.
What spectral bands can optical satellite imagery collect?
Before we get to spectral bands, let's zoom out and look at the electromagnetic spectrum. The spectrum is divided into different frequencies, depending on the range of each frequency's wavelength, as shown below:
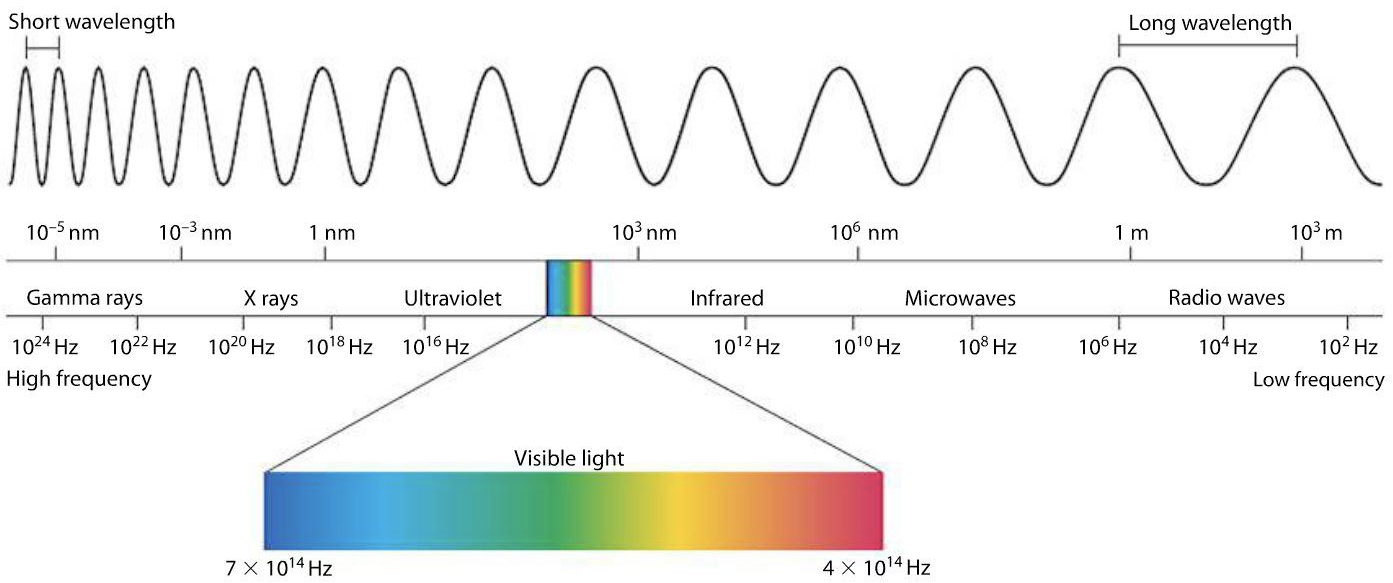
On the far side of the electromagnetic spectrum, we have short wavelengths in the form of gamma rays and X rays, which can be hazardous to organic life in large amounts. Fortunately for us, outside of a nuclear explosion, we're unlikely to run into large amounts of these rays on Earth, and the planet's magnetic sphere protects us from harmful extraterrestrial rays. Radiation gets less dangerous as its wavelength increases: ultraviolet (UV) light, which we most commonly get from the sun, can still be dangerous in large doses but is easier to protect against. Past UV light, we get visible light, microwaves, and radio waves. These types of radiation don't pose any harm to living things.
Optical satellites capture spectral bands on the visible spectrum, with some capabilities on either side. When images combine data from at least three different spectral bands, they're referred to as multispectral images.
Here are the spectral bands that optical satellites are capable of capturing.
The deep blue band
Water can absorb and scatter light, which makes it hard to gain insights via satellite imagery. That's why deep blue operates on the edge of the visible light spectrum, capturing blues and violets. This band can penetrate the water column, making it useful for determining the bathymetry (depth) and quality of water.
The RGB band
The RGB band, as it's commonly referred to, is actually a combination of three different bands: red, blue, and green.
The cone cells, which are the receptive cells in our eyeballs, have the strongest response to the RGB set of colors. The combination of their responses grants us colored vision.
Optical satellites take imagery in all three bands: red, blue, and green. The bands can then be used independently or in combination with other bands. We'll get into the benefits below. When the three primary color bands are combined into one, you get a natural color image.
The red edge band
This is where optical satellites begin to detect wavelengths that are invisible to the human eye. As you might have guessed from its name, the red edge band lies on the cusp of the visible red band and the near infrared band. Its usage is relatively new in remote sensing.
In the red edge band's wavelength, the spectral reflectance of plant life shows huge variations, making this band extremely useful for monitoring vegetation.
The near infrared band
For most optical satellites, this is the limit of their capabilities as wavelengths get longer. Beyond here, you'll need thermal infrared capabilities. But the near infrared (or NIR for short) band allows for a whole slew of impressive use cases.
NIR is most commonly used for measuring reflected sunlight, especially around vegetation, where it can detect density, water content, and the health of a plant in general.
The panchromatic band
Last but not least, we have the panchromatic band. This band is a little different than the ones we've already covered. It collects data across the red, blue, and green wavelengths, merging them together into one image that comes out in greyscale. By doing so, it sacrifices greater spectral resolution (data from 3 or more bands) for improved spatial resolution: a panchromatic image taken by a satellite will have finer detail than a multispectral image taken by the same satellite. For example, Pléiades Neo offers 0.3m resolution for panchromatic images, or 1.2m for multispectral ones. So if you choose the panchromatic band, you'll receive a clearer image, but it will be in black and white, lacking color and all the spectral information that comes with it.
With current technology, advanced as it is, we always have to make this tradeoff between resolutions; we can only increase one type of resolution by decreasing the other. Luckily, there's a workaround. Through a process called pansharpening, you can fuse a multispectral image and a panchromatic image of the same area to get a full-color, high resolution image. You can check out our dedicated post on this topic to find out more.
What can I do with optical satellite imagery?
It might be grandiose to say so, but the potential applications of optical satellite imagery are nearly limitless. Satellite technology has given us a way to understand our planet (and universe) like never before.
Clients often come to us with innovative new use cases. But for the purpose of this article, let's talk about some of the most widely-used and commercially viable ones. Starting with...
Elevation data
By combining optical images of the same area taken at different angles, you can create Digital Elevation Models (DEMs).
DEMs and their subtypes are enormously useful for infrastructure planning and monitoring, for land use planning and monitoring, and for orthorectifying images (removing distortions).
Mapping
This one should come as no surprise. Mapping the Earth's surface with satellite data has made it easier than ever to discover new features and detect changes in existing ones. Google maps became widely available thanks to satellite data, and gives users viewing choices that include natural color images.
One of our favorite examples of how satellite data is useful for mapping is the story of Landsat Island. In 1976, NASA's LANDSAT 1 satellite discovered this previously uncharted island, which is only 1125 meters squared, off the coast of Newfoundland and Labrador. A team was sent out to verify its existence, led by Dr. Frank Hall of the Canadian Hydrographic Service. Upon reaching the island, Dr. Hall dropped down from his helicopter on a rope, only to wake up a polar bear who'd been taking a nap in the snow. Fortunately, his helicopter team yanked him back up.
Ships had no doubt passed this little island countless times, but it took satellite data to properly map it.
Vegetation management & agriculture
Optical satellite images are widely used to monitor vegetation, whether for infrastructure or agriculture. Manually inspecting infrastructure threats from vegetation is an incredibly time-consuming process, especially in areas that are difficult to traverse, such as mountains. For roads, pipelines, or power lines that cross these areas, satellite imagery allows governments and companies to analyze encroachment across thousands of kilometers in one go, and prevent damage before it can occur.
In one innovative use case, one of our customers, LiveEO, uses satellite imagery to detect tree height for one of their clients. By taking images of the earth from different angles, they're able to run their tree height detection algorithm and detect which trees are in danger of threatening railway lines. You can read more about their case here.
When it comes to agriculture, the red, red edge, and NIR bands are widely used. Chlorophyll in plants absorbs more red and blue light and reflects more green and near infrared light. The healthier a plant, the more chlorophyll it has; and the more chlorophyll it has, the more light it can absorb and reflect. Therefore, if you're looking at an image of a forest containing one of the above bands, you'll see that the healthy plants reflect and absorb more light than the unhealthy ones.
This information saves huge amounts of time and money, especially for large farms. There are plenty of things that can impact a crop yield, from poor or uneven irrigation and fertilization to pest infestations. With satellite data, farmers and organizations can detect problems before they're identifiable in person, enabling them to address the issue before it gets worse. And with high resolution imagery, even a single dehydrated tree can be pinpointed.
Coastal monitoring
Sea level rise is becoming a serious threat to coastal infrastructure. Historical satellite data plays an important part in the understanding of rising sea levels, and future satellite data will be just as important in adapting to it.
By using elevation data, we can detect areas that are at risk of flooding, or see where infrastucture might be most impacted due to sea level rise. Find out more about adapting to sea level rise with satellite data here.
How can I get access to optical satellite imagery?
The UP42 platform hosts optical satellite imagery from the world's leading providers, including Maxar, Planet, Airbus (Pléiades Neo, Pléiades, and SPOT 6/7 constellations), 21AT (TripleSat constellation), and more. Visit our marketplace for more details on each of them. You can choose from a wide selection of archive data, or task a satellite constellation to take brand-new imagery.
You can access the UP42 platform in three ways:
-
API: as an API-first platform, we make it easy for developers to explore our data offerings. Check out our documentation to learn about the requirements and how to set up authentication. Once that's done, you can explore our offerings through data discovery, or, if you know the area that you're interested in, look for specific coordinates through data search.
-
Console: The UP42 console, accessible through your browser, enables easy access to satellite data for any type of user. Upload your AOI or draw it yourself, then define your parameters, such as cloud cover, and view the credits required before placing your order.
-
Python SDK: Our Python SDK grants full access to the UP42 platform for Python users.
With the power of optical satellite imagery at your fingertips, you can solve all sorts of business challenges. You can supplement it with other types of imagery, like synthetic aperture radar satellites, to unlock even more potential. Want to kick it off with satellite data, but not sure where to start? Just reach out–our sales team would be happy to help.


